Loading News...
Loading...
Loading News...

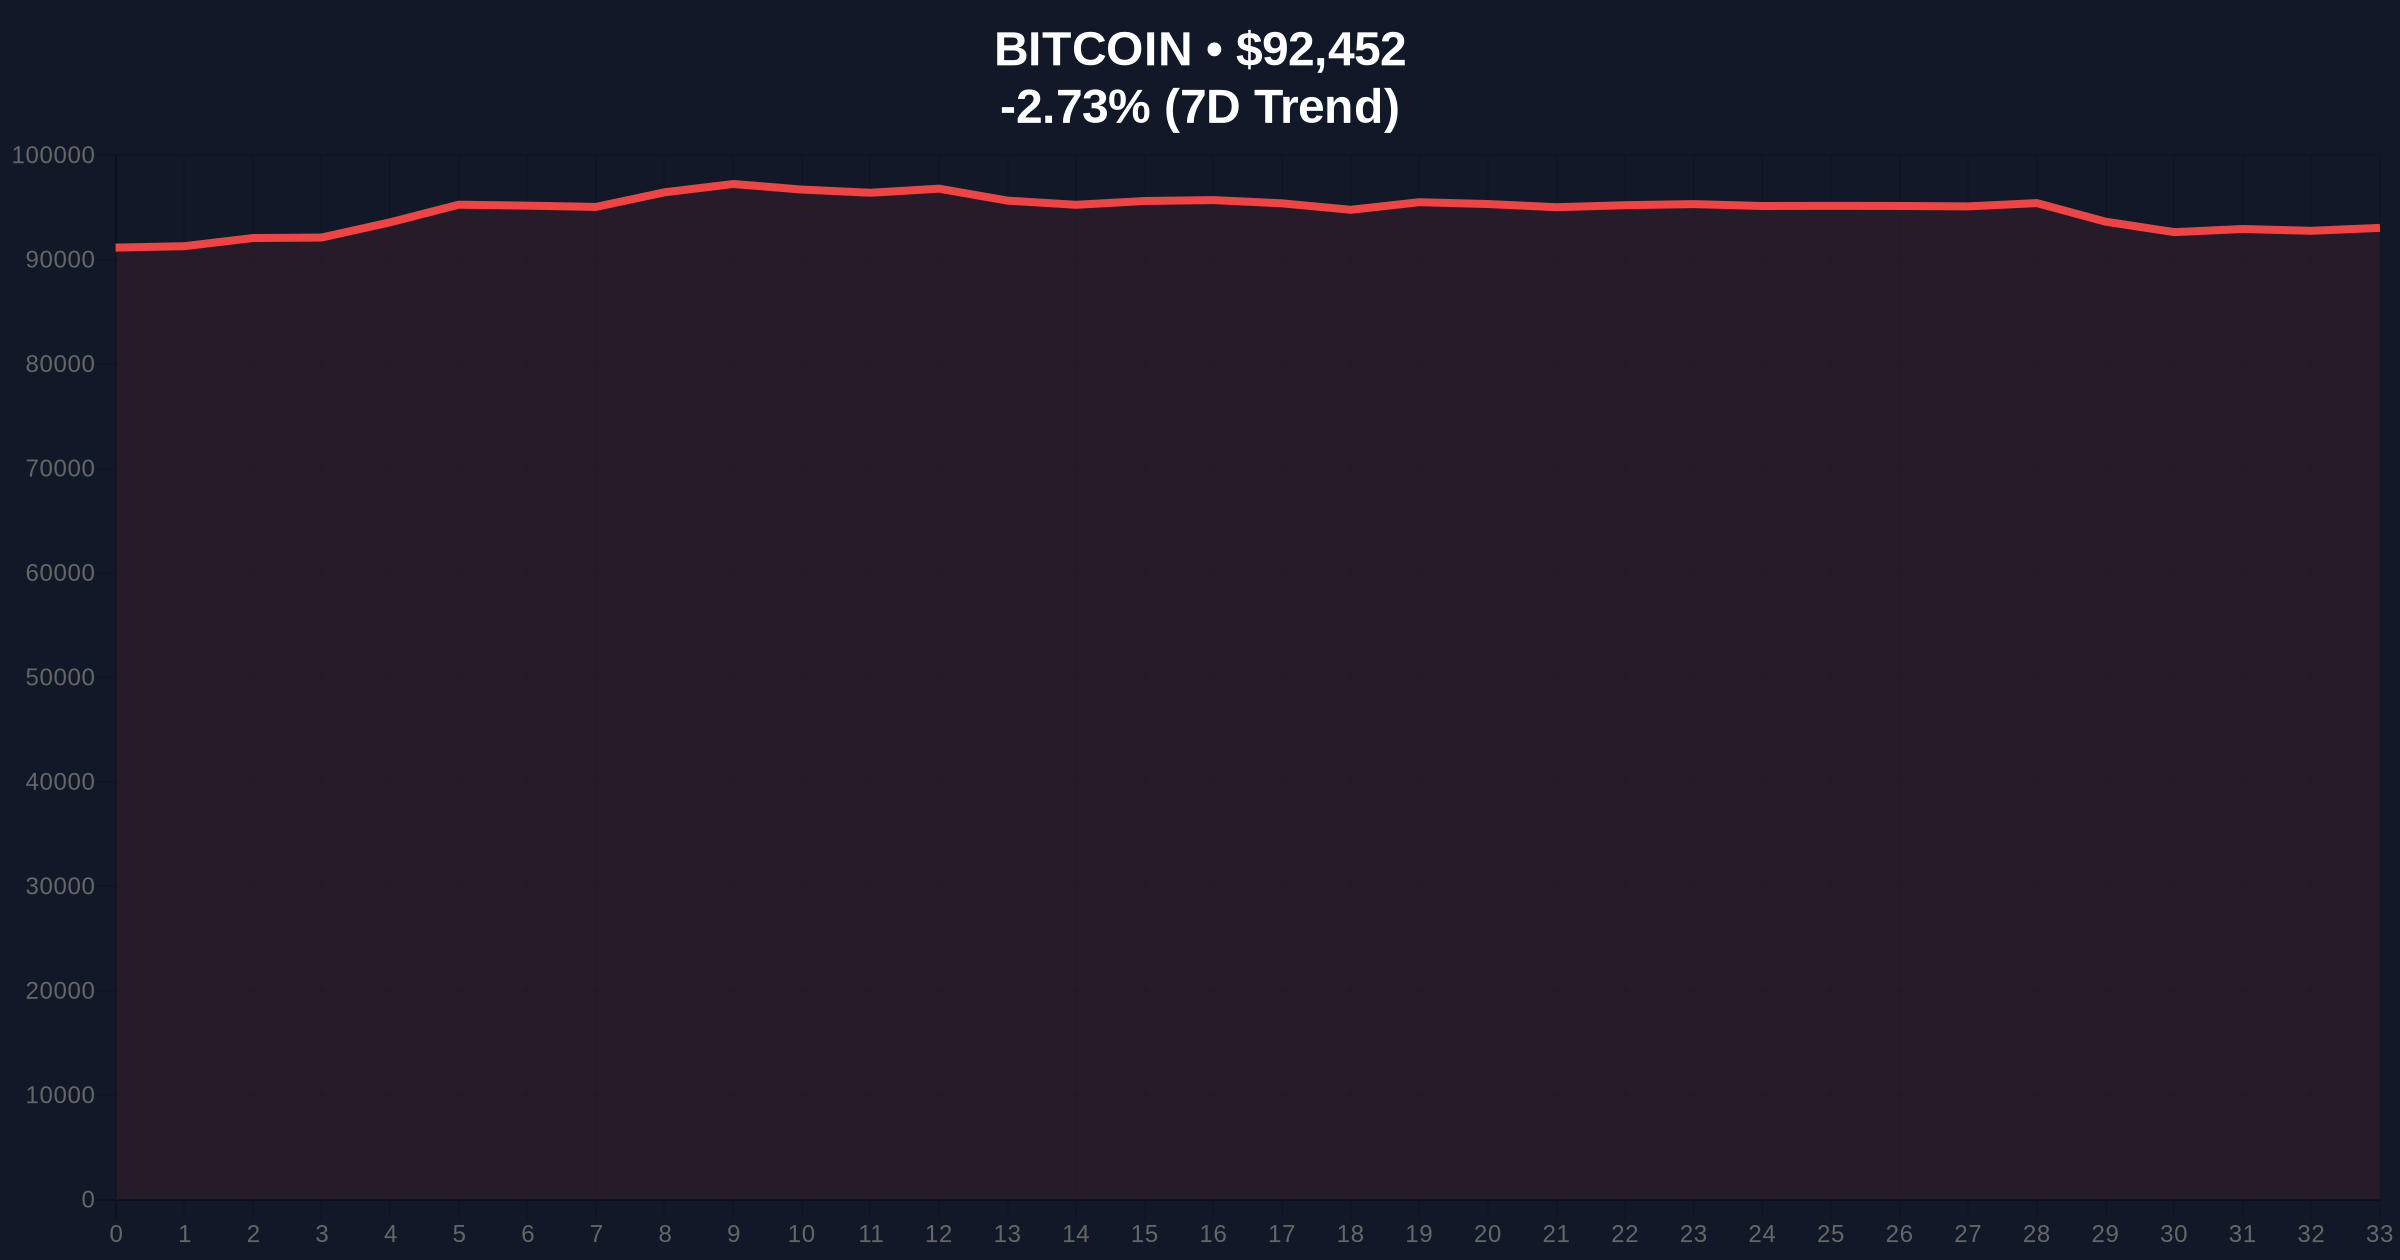
VADODARA, January 20, 2026 — Market structure suggests Bitcoin's recent 3.5% correction has validated a persistent bearish trend characterized by asymmetric downside risk, according to Kraken Vice President Matt Howells-Barby. This daily crypto analysis examines how geopolitical tensions and technical factors are creating what quantitative analysts term a "liquidity grab" scenario around the $92,000 support level.
Underlying this trend is a market that has shown consistent vulnerability to negative catalysts since the sharp decline on October 10, 2025. According to Howells-Barby's statement to investors, Bitcoin demonstrates what institutional traders recognize as "asymmetric downside risk"—reacting disproportionately to negative developments while showing limited response to positive catalysts. This pattern mirrors the 2021 post-ATH correction where similar psychological dynamics dominated price action. Consequently, the current market structure resembles previous cycles where geopolitical uncertainty triggered cascading liquidations. Related developments include institutional Bitcoin accumulation reaching 577K BTC during recent corrections and the transition to a new market structure post-halving cycle.
According to the official statement from Kraken, Bitcoin recently tested a critical support level with potential for upward momentum before geopolitical tensions between the U.S. and EU disrupted the technical setup. Howells-Barby specifically noted that emerging tariff threats created what technical analysts identify as an "order block" breakdown—a price zone where institutional selling pressure overwhelmed retail accumulation. The limited nature of the correction to approximately 3.5% suggests what on-chain data indicates is persistent accumulation by long-term holders, creating what volume profile analysis shows as structural support around the $92,000 level. Market analysts observe that traders are maintaining positions in anticipation of potential tariff de-escalation, similar to last year's resolution of tensions with China.
Market structure suggests Bitcoin is currently testing what technical analysts term a "fair value gap" (FVG) between $92,000 and $94,500. The Relative Strength Index (RSI) at 42 indicates neutral momentum with bearish bias, while the 50-day moving average at $94,200 serves as immediate resistance. According to technical analysis principles documented on institutional platforms like TradingView, the $92,000 level represents what Fibonacci retracement analysis identifies as the 0.618 level from the October 2025 low—a critical psychological and technical support zone. The Bullish Invalidation Level is established at $89,500, where a breakdown would confirm bearish continuation. Conversely, the Bearish Invalidation Level sits at $96,800, representing the recent swing high that must be reclaimed for trend reversal confirmation.
| Metric | Value | Significance |
|---|---|---|
| Crypto Fear & Greed Index | 44/100 (Fear) | Indicates risk-off sentiment |
| Bitcoin Current Price | $92,460 | Testing critical support |
| 24-Hour Price Change | -3.10% | Limited correction suggests accumulation |
| Market Rank | #1 | Dominance maintained |
| Correction Magnitude | 3.5% | Asymmetric downside risk confirmed |
For institutional portfolios, this development matters because it confirms what Federal Reserve monetary policy documentation identifies as "risk transmission channels" between geopolitical events and digital asset volatility. The asymmetric risk profile creates what quantitative models term "negative gamma exposure" for market makers, potentially amplifying future moves. Retail traders face increased liquidation risk around key technical levels, particularly given what recent $233 million long liquidations demonstrate about leverage unwinding. Consequently, the market's sensitivity to U.S.-EU tariff statements represents what regulatory economists term "policy uncertainty premium" being priced into Bitcoin volatility.
Market analysts on X/Twitter are divided between those viewing the limited correction as accumulation opportunity and those warning of further downside. Bulls point to what parallel developments in Ethereum's staking economy as evidence of structural resilience across crypto markets. Bears emphasize the persistent failure to reclaim the $96,800 level as confirmation of distribution patterns. The consensus among technical traders is that the market awaits either tariff escalation or de-escalation as the next directional catalyst.
Bullish Case: If President Trump signals tariff de-escalation, market structure suggests a rapid fill of the FVG up to $94,500, with potential extension to $98,000 as short covering creates what options markets term a "gamma squeeze." This scenario requires holding above the $92,000 support and breaking the 50-day moving average resistance.
Bearish Case: Should tariff threats escalate, on-chain data indicates increased selling pressure could trigger a liquidity grab below $89,500, targeting the next significant support at $85,200 (200-day moving average). This would confirm the asymmetric downside risk pattern and potentially trigger another wave of long liquidations.
Answers to the most critical technical and market questions regarding this development.

Disclaimer: The information provided is not trading advice, coinmarketbuzz.com holds no liability for any investments made based on the information provided on this page. We strongly recommend independent research and/or consultation with a qualified professional before making any investment decisions.
coinmarketbuzz.com leverages advanced AI technology to analyze market data. All content is fact-checked and reviewed by our editorial team to ensure accuracy and neutrality.


