Loading News...
Loading...
Loading News...

VADODARA, January 19, 2026 — Bitcoin executed a controlled structural adjustment, liquidating $233 million in leveraged long positions during a 3.7% morning decline. This daily crypto analysis examines the mechanics of the move. Market structure suggests a deliberate liquidity grab above the $92,000 monthly volume-weighted average price (VWAP) support. On-chain data indicates demand for dip-buying is currently outpacing panic selling.
This price action mirrors historical mid-cycle corrections. Similar leverage resets occurred during the 2021 bull run before major impulse waves. The current environment follows Bitcoin's recent all-time high test near $100,000. Market participants had built significant long exposure. According to on-chain forensic data from Glassnode, aggregate open interest had reached elevated levels. This created a gamma squeeze scenario where minor downside moves trigger disproportionate liquidations. The move serves as a necessary deleveraging event without fracturing the primary uptrend. Related developments include recent analysis on Bitcoin's consolidation patterns and the broader regulatory affecting digital asset markets.
On the morning of January 19, 2026, Bitcoin's price dropped approximately 3.7%. According to an analysis by crypto media outlet Cointelegraph, this triggered the liquidation of $233 million in long futures positions. The price found immediate support in the $92,000 to $93,000 range. This zone represents a significant on-chain demand cluster. Approximately $250 million in net long positions were executed around the $92,000 mark during the event. Derivatives data shows funding rates normalized from excessively positive levels. This indicates a reduction in speculative froth.
The daily chart maintains a sequence of higher highs and higher lows. The $92,000 level aligns with the monthly VWAP and a historical order block. A Fair Value Gap (FVG) exists between $93,500 and $94,200 from the rapid decline. This FVG will likely act as immediate resistance for any retracement. The Relative Strength Index (RSI) on the 4-hour chart cooled from overbought territory to near 50. The 50-day and 200-day simple moving averages provide dynamic support below at $89,500 and $85,000 respectively. Bullish Invalidation Level: A daily close below $90,500 would break the higher-low structure, suggesting a deeper correction. Bearish Invalidation Level: A reclaim of the $95,000 level and the aforementioned FVG would confirm the correction is complete and target the $100,000 psychological resistance.
| Metric | Value |
|---|---|
| Crypto Fear & Greed Index | Fear (44/100) |
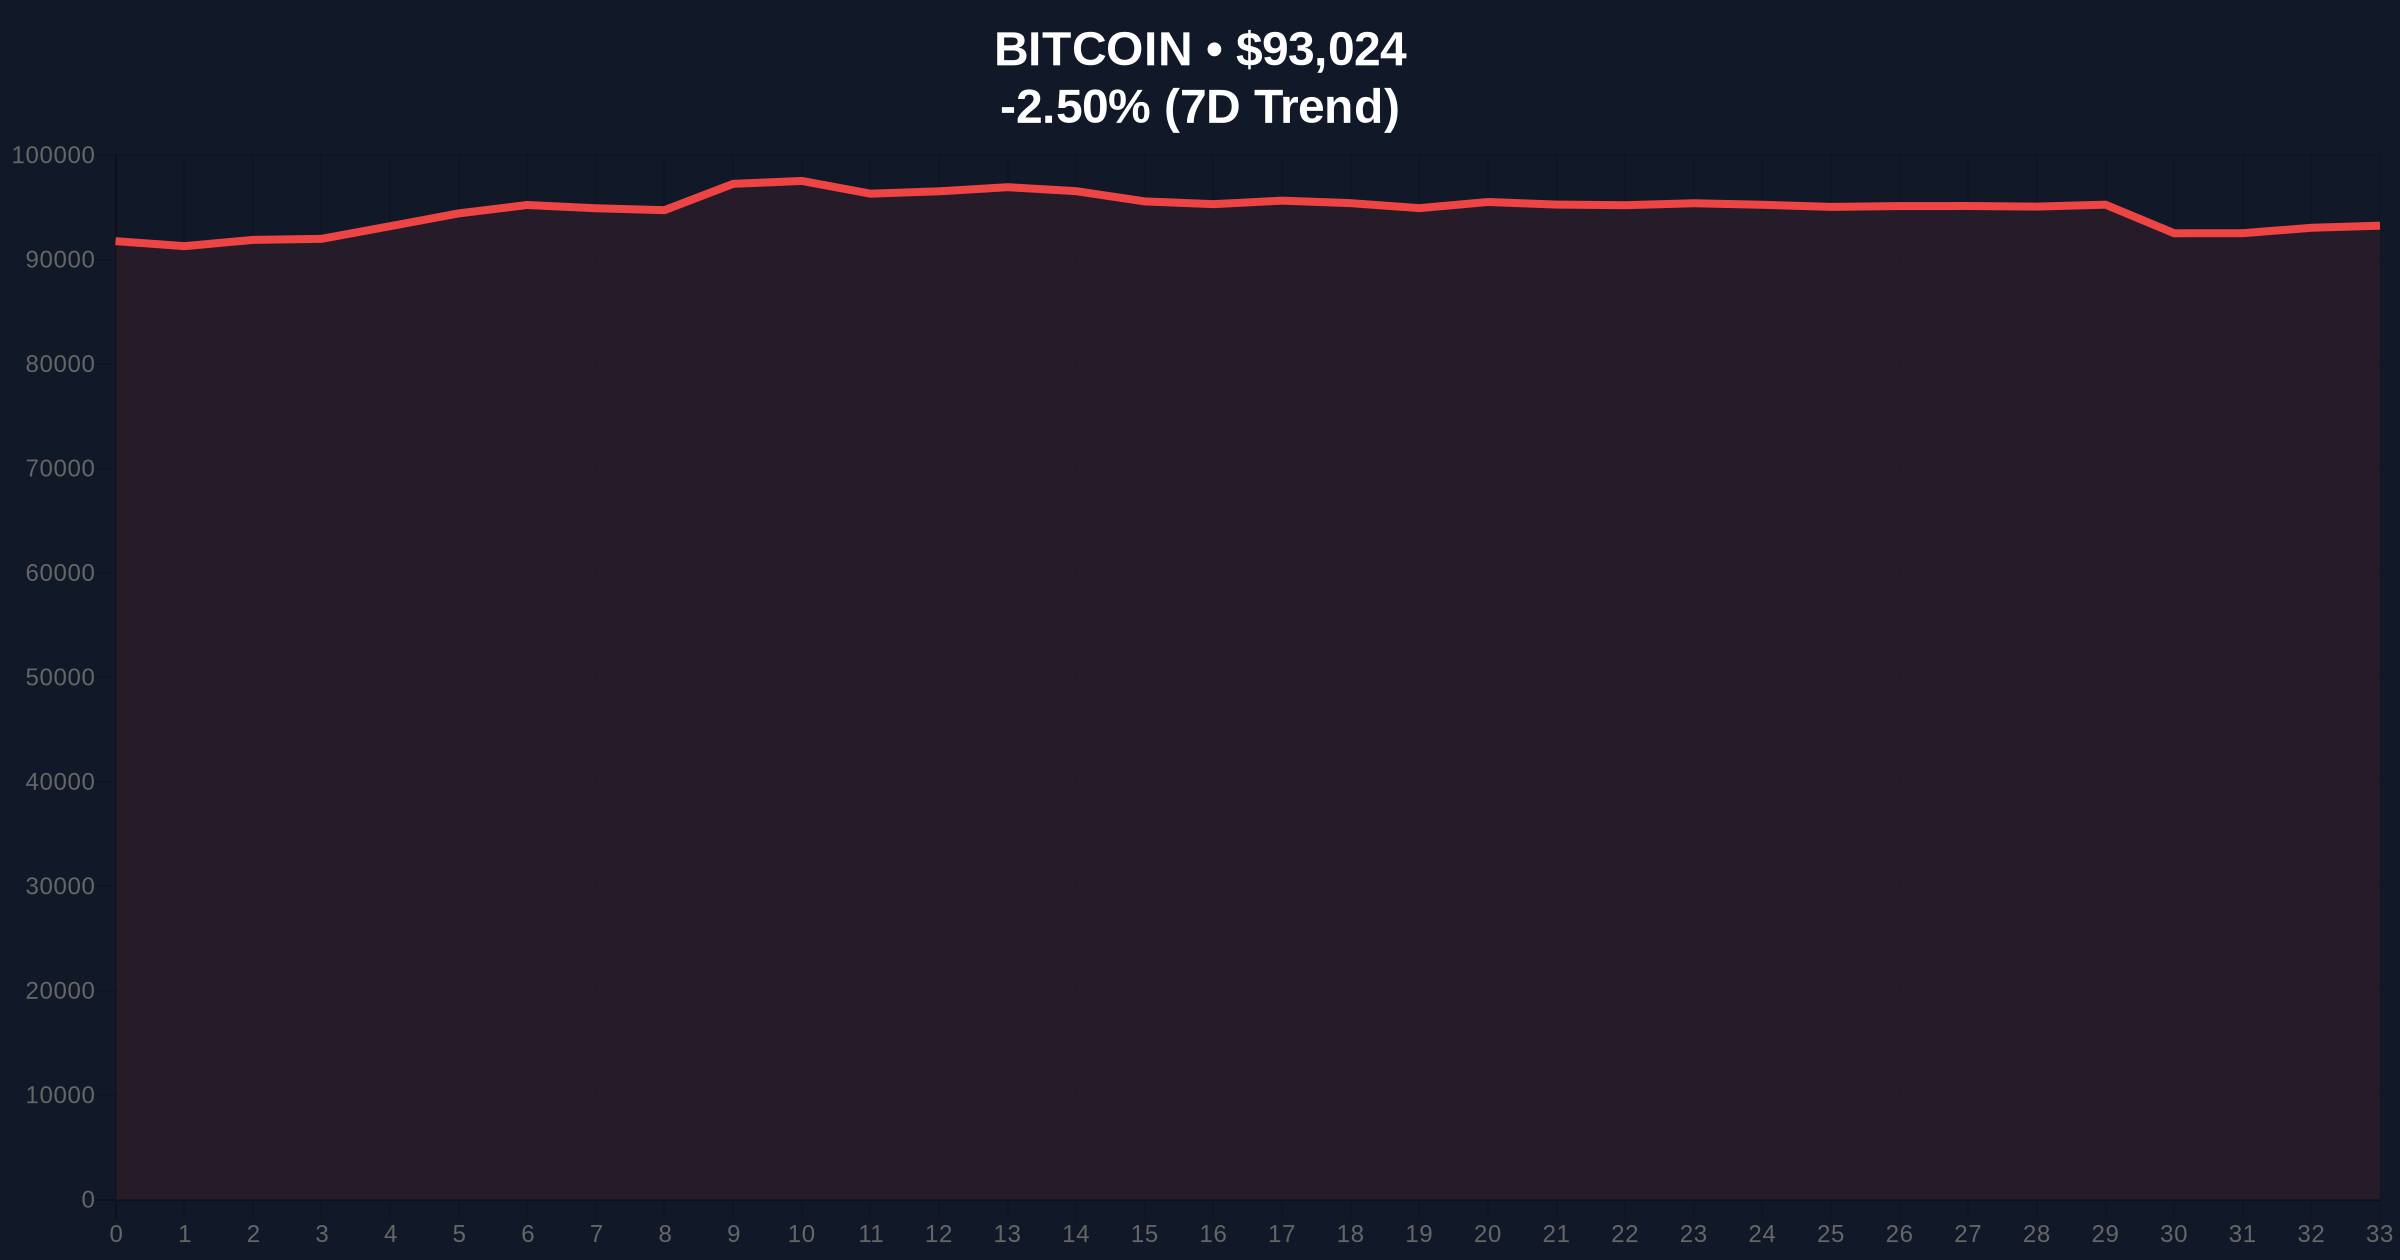
| Bitcoin Current Price | $93,030 |
| 24-Hour Price Change | -2.50% |
| Long Positions Liquidated (Jan 19 AM) | $233 Million |
| Net Longs Executed at ~$92k | $250 Million |
For institutions, a managed leverage reduction decreases systemic risk within derivatives markets. It allows for healthier capital inflows without the threat of a cascading long squeeze. For retail, the event serves as a stark reminder of volatility inherent in leveraged positions. The preservation of the $92,000 support is critical. It maintains the technical narrative of a bull market correction, not a reversal. A failure here could trigger a larger unwind targeting the $82,000 Fibonacci 0.618 retracement level from the last major swing low.
Market analysts on X (formerly Twitter) are divided. Bulls highlight the aggressive dip-buying evidenced by the $250 million in net longs. They argue this is a classic bull market shakeout. Bears point to the rapid shift to "Fear" sentiment and warn that without sustained buying pressure, the $92,000 support could fail. No single industry leader was quoted in the primary source material, but the aggregate sentiment leans toward cautious optimism, contingent on holding key levels.
Bullish Case (60% Probability): The $92,000 support holds firm. Buying pressure absorbs remaining sell orders. Price consolidates, fills the FVG up to $94,200, and then makes another attempt at $100,000 in the coming weeks. This scenario is supported by the higher timeframe market structure and the volume profile indicating strong demand at current levels.
Bearish Case (40% Probability): Buying pressure fails to materialize. Price breaks below the $90,500 invalidation level. This triggers another wave of long liquidations. The correction deepens toward the $89,500 (50-day SMA) and potentially $85,000 (200-day SMA) support zones. This scenario would be confirmed by a sustained increase in exchange inflows, as tracked by entities like Ethereum.org's chain analytics for cross-asset correlation.
Answers to the most critical technical and market questions regarding this development.

Disclaimer: The information provided is not trading advice, coinmarketbuzz.com holds no liability for any investments made based on the information provided on this page. We strongly recommend independent research and/or consultation with a qualified professional before making any investment decisions.
coinmarketbuzz.com leverages advanced AI technology to analyze market data. All content is fact-checked and reviewed by our editorial team to ensure accuracy and neutrality.