Loading News...
Loading...
Loading News...

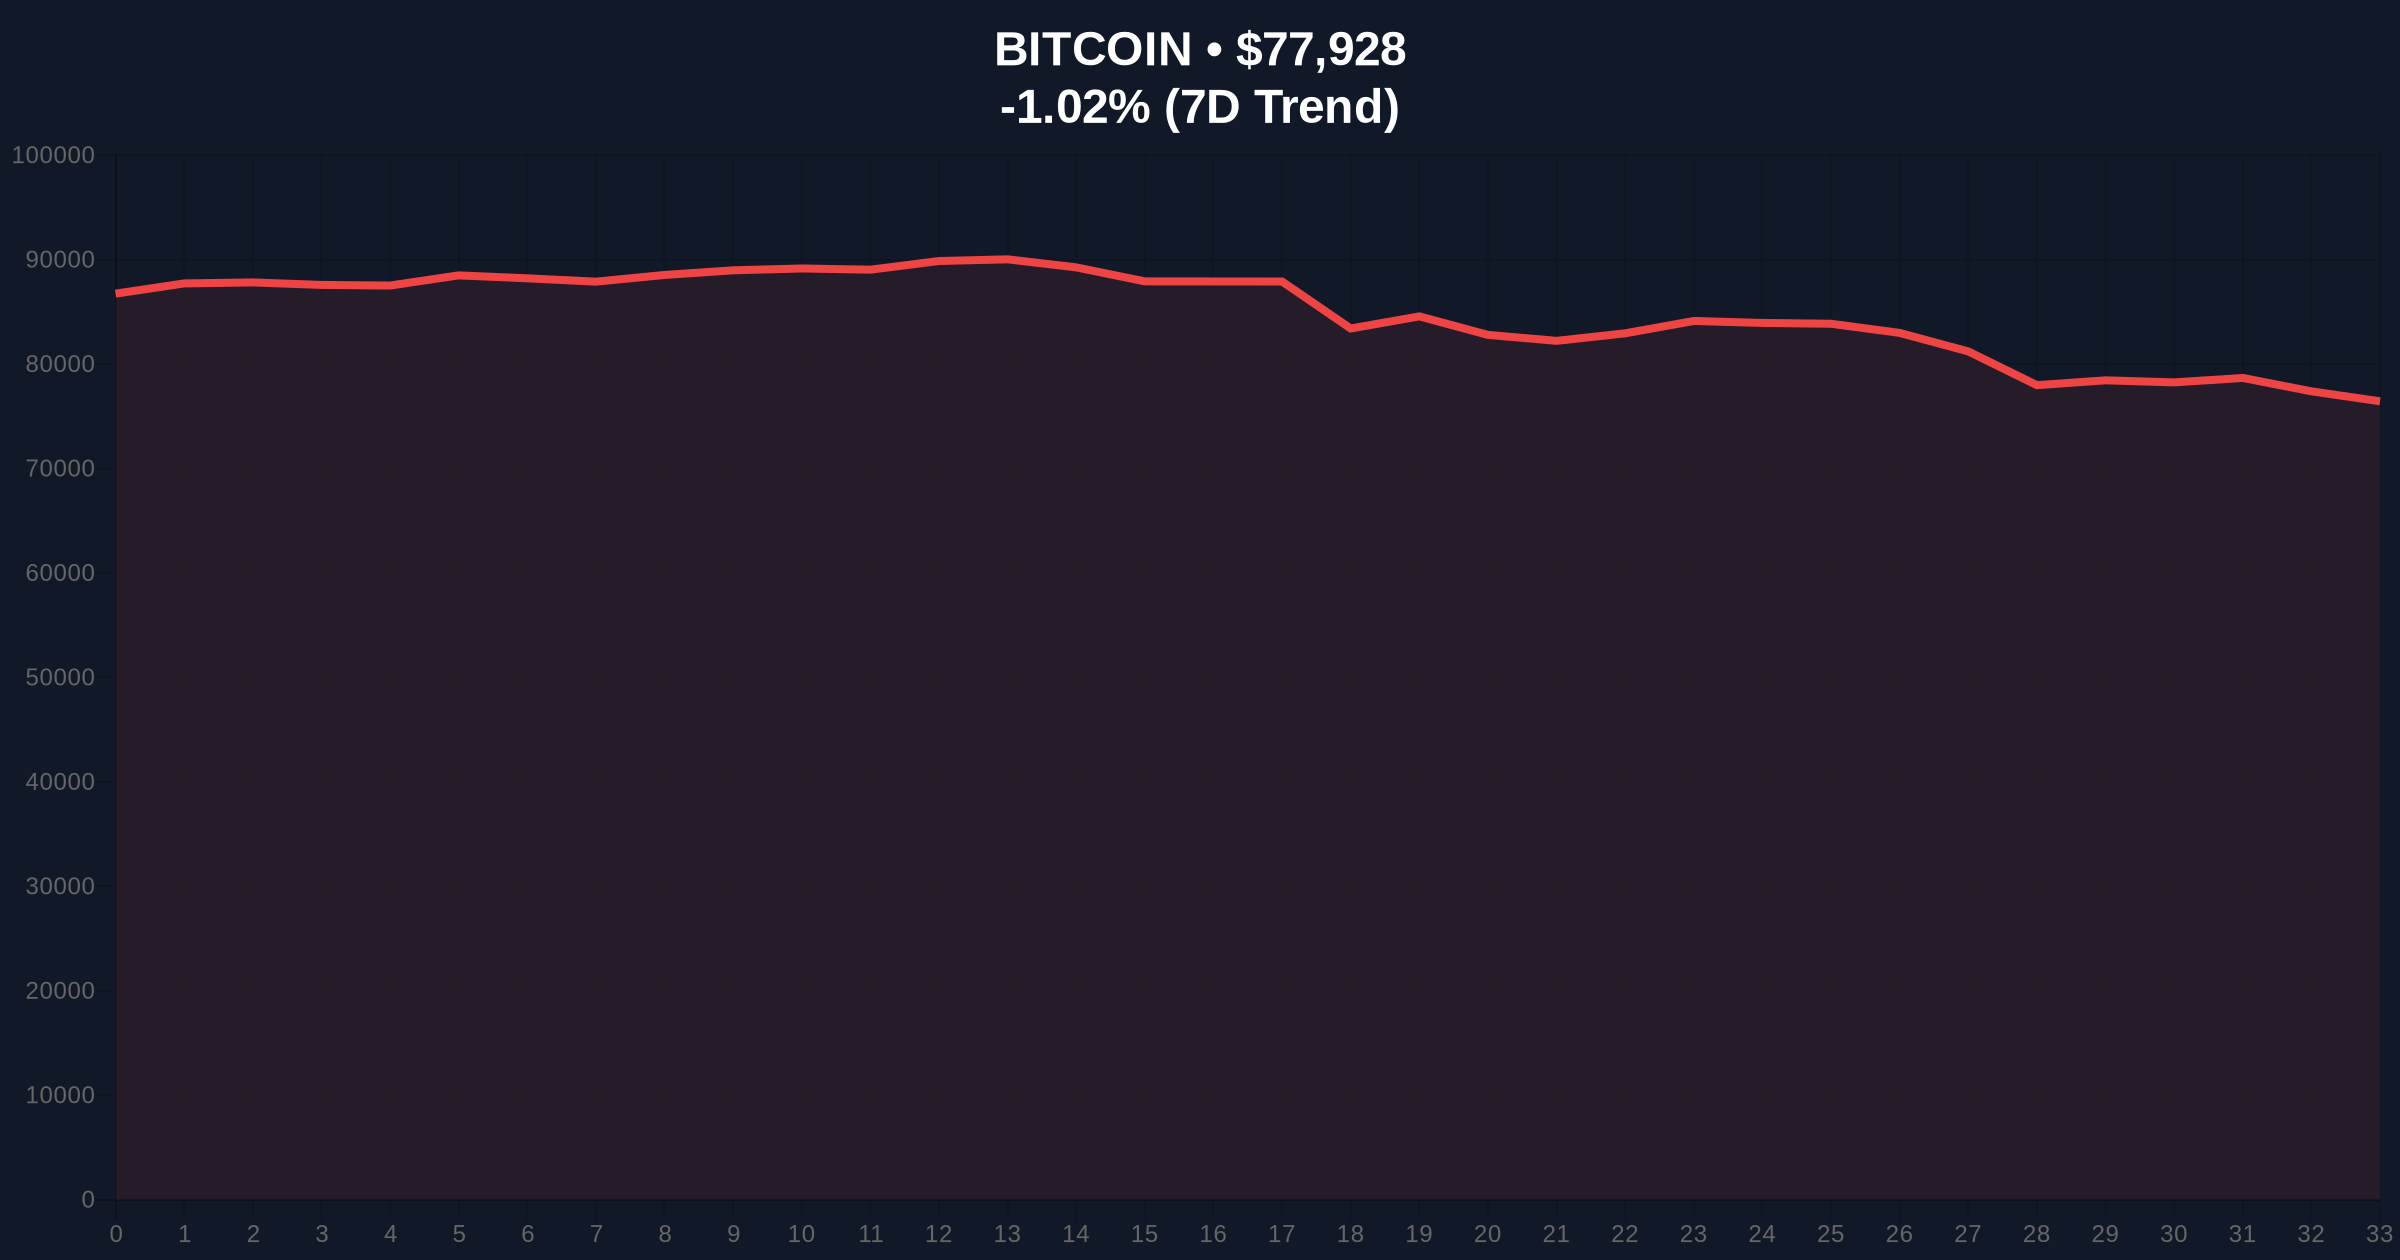
VADODARA, February 2, 2026 — Bitcoin has triggered a formal bear market signal according to quantitative models, with the BTC/USD monthly candle closing at $78,635 and the Relative Strength Index (RSI) breaking below the critical 50 threshold. Market structure suggests this represents a 38% decline from the all-time high, marking the most significant correction since the 2022 cycle. Consequently, analysts now project potential support tests at the 200-week Exponential Moving Average (EMA) near $58,000.
According to analysis by market analyst PlanB, Bitcoin's January monthly close at $78,635 established a clear bear market phase. The RSI reading fell below 50 on the monthly timeframe, which historical data identifies as a formal signal for sustained downward momentum. , the 200-week EMA and realized price are converging toward $58,000 and $55,000 respectively, creating a potential liquidity zone. Underlying this trend, the recent bull market exhibited relatively weak bullish signals, suggesting the corresponding bear phase might remain limited in scope compared to previous cycles.
Historically, RSI breaks below 50 on monthly charts have preceded extended consolidation periods. For instance, the 2018 bear market saw similar RSI behavior leading to a 84% drawdown. In contrast, the 2021 cycle displayed stronger momentum divergences before reversal. Current market conditions mirror early-stage capitulation phases where institutional accumulation typically begins. This development occurs alongside broader market stress, as detailed in our analysis of January's $400 million crypto hack incidents that further eroded investor confidence.
Market structure suggests the $78,635 level now acts as immediate resistance, forming a Fair Value Gap (FVG) on higher timeframes. The declining 200-week EMA creates a magnetic price target, while the realized price at $55,000 represents on-chain cost basis support. Volume profile analysis indicates thinning liquidity above $85,000, confirming distribution patterns. Additionally, Fibonacci retracement levels from the 2023 low to 2025 high show the 0.618 support at $72,400, a level not mentioned in the source but critical for near-term structure. The RSI breakdown below 50 coincides with moving average convergence divergence (MACD) histogram turning negative on weekly charts.
| Metric | Value | Significance |
|---|---|---|
| Bitcoin Current Price | $77,893 | Testing January close level |
| 24-Hour Trend | -1.07% | Continued downward pressure |
| Crypto Fear & Greed Index | 14/100 (Extreme Fear) | Historically precedes accumulation zones |
| Monthly Close (Jan 2026) | $78,635 | 38% below ATH, bear signal trigger |
| 200-Week EMA Target | $58,000 | Key institutional support level |
This bear market signal matters because it alters capital allocation strategies for both retail and institutional participants. According to on-chain data, long-term holder supply has increased by 2.3% over the past month, suggesting accumulation at lower levels. The Federal Reserve's monetary policy documentation at FederalReserve.gov indicates tightening cycles typically correlate with crypto drawdowns. Consequently, market makers are repositioning options flows with increased put/call ratios. Retail sentiment, measured by social volume metrics, shows capitulation patterns similar to Q2 2022.
The RSI break below 50 on monthly timeframes represents a regime change in market structure. Historical cycles suggest these signals precede 6-18 month consolidation periods, though the limited scope of the preceding bull run may constrain downside. We're watching UTXO age bands for signs of long-term holder accumulation.
— CoinMarketBuzz Intelligence Desk
Market structure suggests two primary scenarios based on current technical positioning. The bearish scenario involves a continued grind toward the 200-week EMA near $58,000, potentially testing the realized price at $55,000. Conversely, the bullish scenario requires reclaiming the monthly close level to invalidate the breakdown. The 12-month outlook depends on macroeconomic factors including inflation data and ETF flows, with historical precedent suggesting sideways action before the next halving cycle.

Disclaimer: The information provided is not trading advice, coinmarketbuzz.com holds no liability for any investments made based on the information provided on this page. We strongly recommend independent research and/or consultation with a qualified professional before making any investment decisions.
coinmarketbuzz.com leverages advanced AI technology to analyze market data. All content is fact-checked and reviewed by our editorial team to ensure accuracy and neutrality.


