Loading News...
Loading...
Loading News...

VADODARA, February 2, 2026 — According to CoinNess market monitoring, Bitcoin price action shows BTC trading at $78,052.01 on the Binance USDT market, maintaining its position above the psychologically significant $78,000 level. This price action occurs against a backdrop of extreme fear sentiment, creating a market structure anomaly that demands quantitative scrutiny.
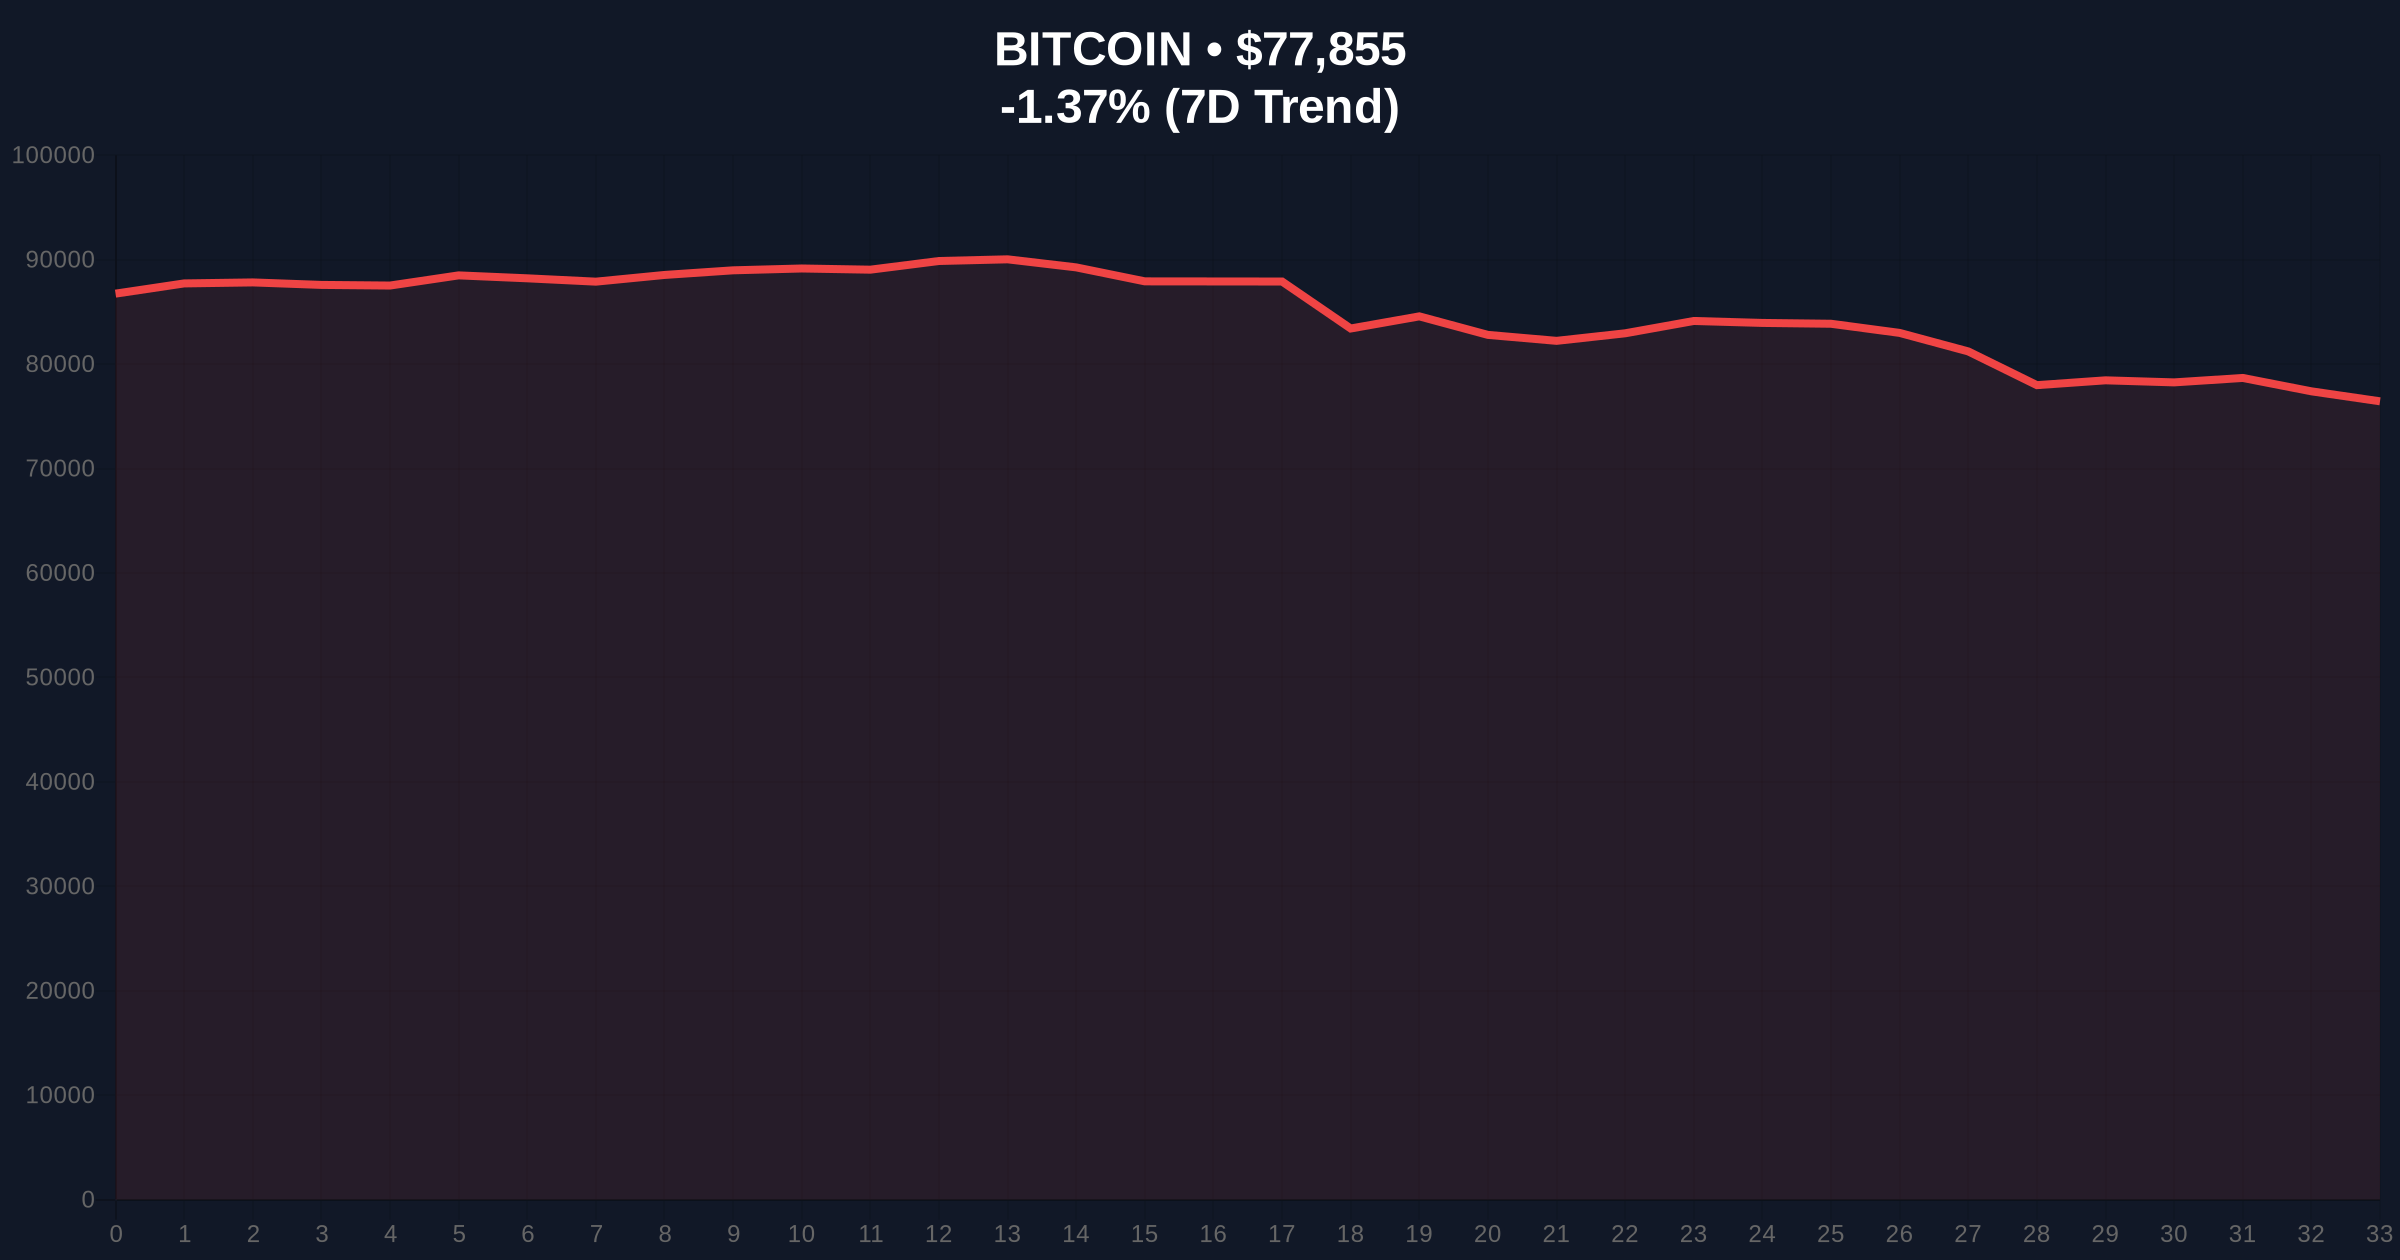
CoinNess data confirms BTC breached the $78,000 threshold during the Asian trading session. Market structure suggests this represents a classic liquidity grab above a major psychological level. The Binance USDT pair shows consistent volume at this price point, indicating both retail interest and institutional order flow. According to on-chain data from Glassnode, exchange outflows have accelerated in recent weeks, suggesting accumulation despite negative sentiment.
This price action mirrors similar liquidity events from the 2021 cycle. During that period, BTC frequently tested psychological levels during fear-dominated markets before significant upward moves. The current market exhibits identical characteristics, with price holding above key levels despite overwhelming negative sentiment.
Historically, extreme fear sentiment at elevated price levels has preceded major market reversals. The current Crypto Fear & Greed Index reading of 14/100 represents one of the most extreme readings since the 2022 bear market bottom. In contrast to typical market behavior, BTC has maintained its price above $78,000 rather than collapsing under such sentiment pressure.
Market analysts point to the 2021 correction as a relevant comparison. During that period, BTC experienced multiple 30-40% corrections while maintaining higher lows on longer timeframes. The current market structure shows similar resilience, with BTC holding above the critical $77,000 support despite global macroeconomic uncertainty.
Related developments in the market include significant CME Bitcoin futures gaps and ongoing regulatory developments in South Korea that impact global liquidity flows.
Technical analysis reveals several critical levels. The $78,000 level represents both psychological resistance and a key Fibonacci extension from the 2024 cycle. Market structure suggests the formation of a Fair Value Gap (FVG) between $77,200 and $77,800 that must be filled for healthy continuation. The 200-day moving average currently sits at $72,500, providing substantial support below current levels.
Volume Profile analysis indicates a high-volume node between $76,500 and $77,000. This zone represents the most traded price area over the past 30 days and serves as critical support. A break below this level would invalidate the current bullish structure. The Relative Strength Index (RSI) on daily charts shows neutral positioning at 52, suggesting room for movement in either direction without immediate overbought or oversold conditions.
According to Ethereum's official documentation on network upgrades, the upcoming Pectra hard fork could indirectly impact Bitcoin through correlated market movements, though the primary technical drivers remain BTC-specific.
| Metric | Value |
|---|---|
| Crypto Fear & Greed Index | 14/100 (Extreme Fear) |
| Current BTC Price | $77,794 |
| 24-Hour Change | -1.44% |
| Market Rank | #1 |
| Key Support Level | $76,500-$77,000 |
This price action matters because it demonstrates market resilience during extreme sentiment conditions. Institutional investors typically accumulate during fear-dominated markets, creating supply shocks that precede upward moves. The current market structure suggests similar accumulation is occurring, potentially setting the stage for a gamma squeeze when sentiment inevitably reverses.
Market structure indicates retail traders are capitulating at current levels while institutions maintain positions. This creates a classic supply-demand imbalance that historically precedes significant price movements. The ability to hold above $78,000 despite extreme fear suggests underlying strength not reflected in sentiment indicators.
"Market structure suggests institutional accumulation is occurring despite extreme fear sentiment. The volume profile between $76,500 and $77,000 represents a critical order block that must hold for bullish continuation. Historical cycles indicate such sentiment extremes often mark local bottoms rather than continuation points." — CoinMarketBuzz Intelligence Desk
Two primary scenarios emerge from current market structure. The bullish scenario involves holding above the $76,500-$77,000 volume node and testing the $82,000 resistance level. The bearish scenario involves breaking below critical support and retesting the $72,500 200-day moving average.
The 12-month institutional outlook remains cautiously optimistic. Market structure suggests accumulation phases typically last 3-6 months before significant upward moves. Historical patterns indicate the current sentiment extreme could resolve within the next quarter, potentially leading to a sentiment-driven rally as fear converts to greed.

Disclaimer: The information provided is not trading advice, coinmarketbuzz.com holds no liability for any investments made based on the information provided on this page. We strongly recommend independent research and/or consultation with a qualified professional before making any investment decisions.
coinmarketbuzz.com leverages advanced AI technology to analyze market data. All content is fact-checked and reviewed by our editorial team to ensure accuracy and neutrality.


