Loading News...
Loading...
Loading News...

VADODARA, February 2, 2026 — Bitcoin price action turned decisively bearish as BTC broke below the $77,000 psychological support level. According to CoinNess market monitoring, BTC traded at $76,948.42 on the Binance USDT market, marking a -1.98% decline in 24 hours. This move occurred against a backdrop of Extreme Fear sentiment, with the Crypto Fear & Greed Index hitting 14/100. Market structure suggests this is not an isolated event but part of a broader institutional de-leveraging cycle.
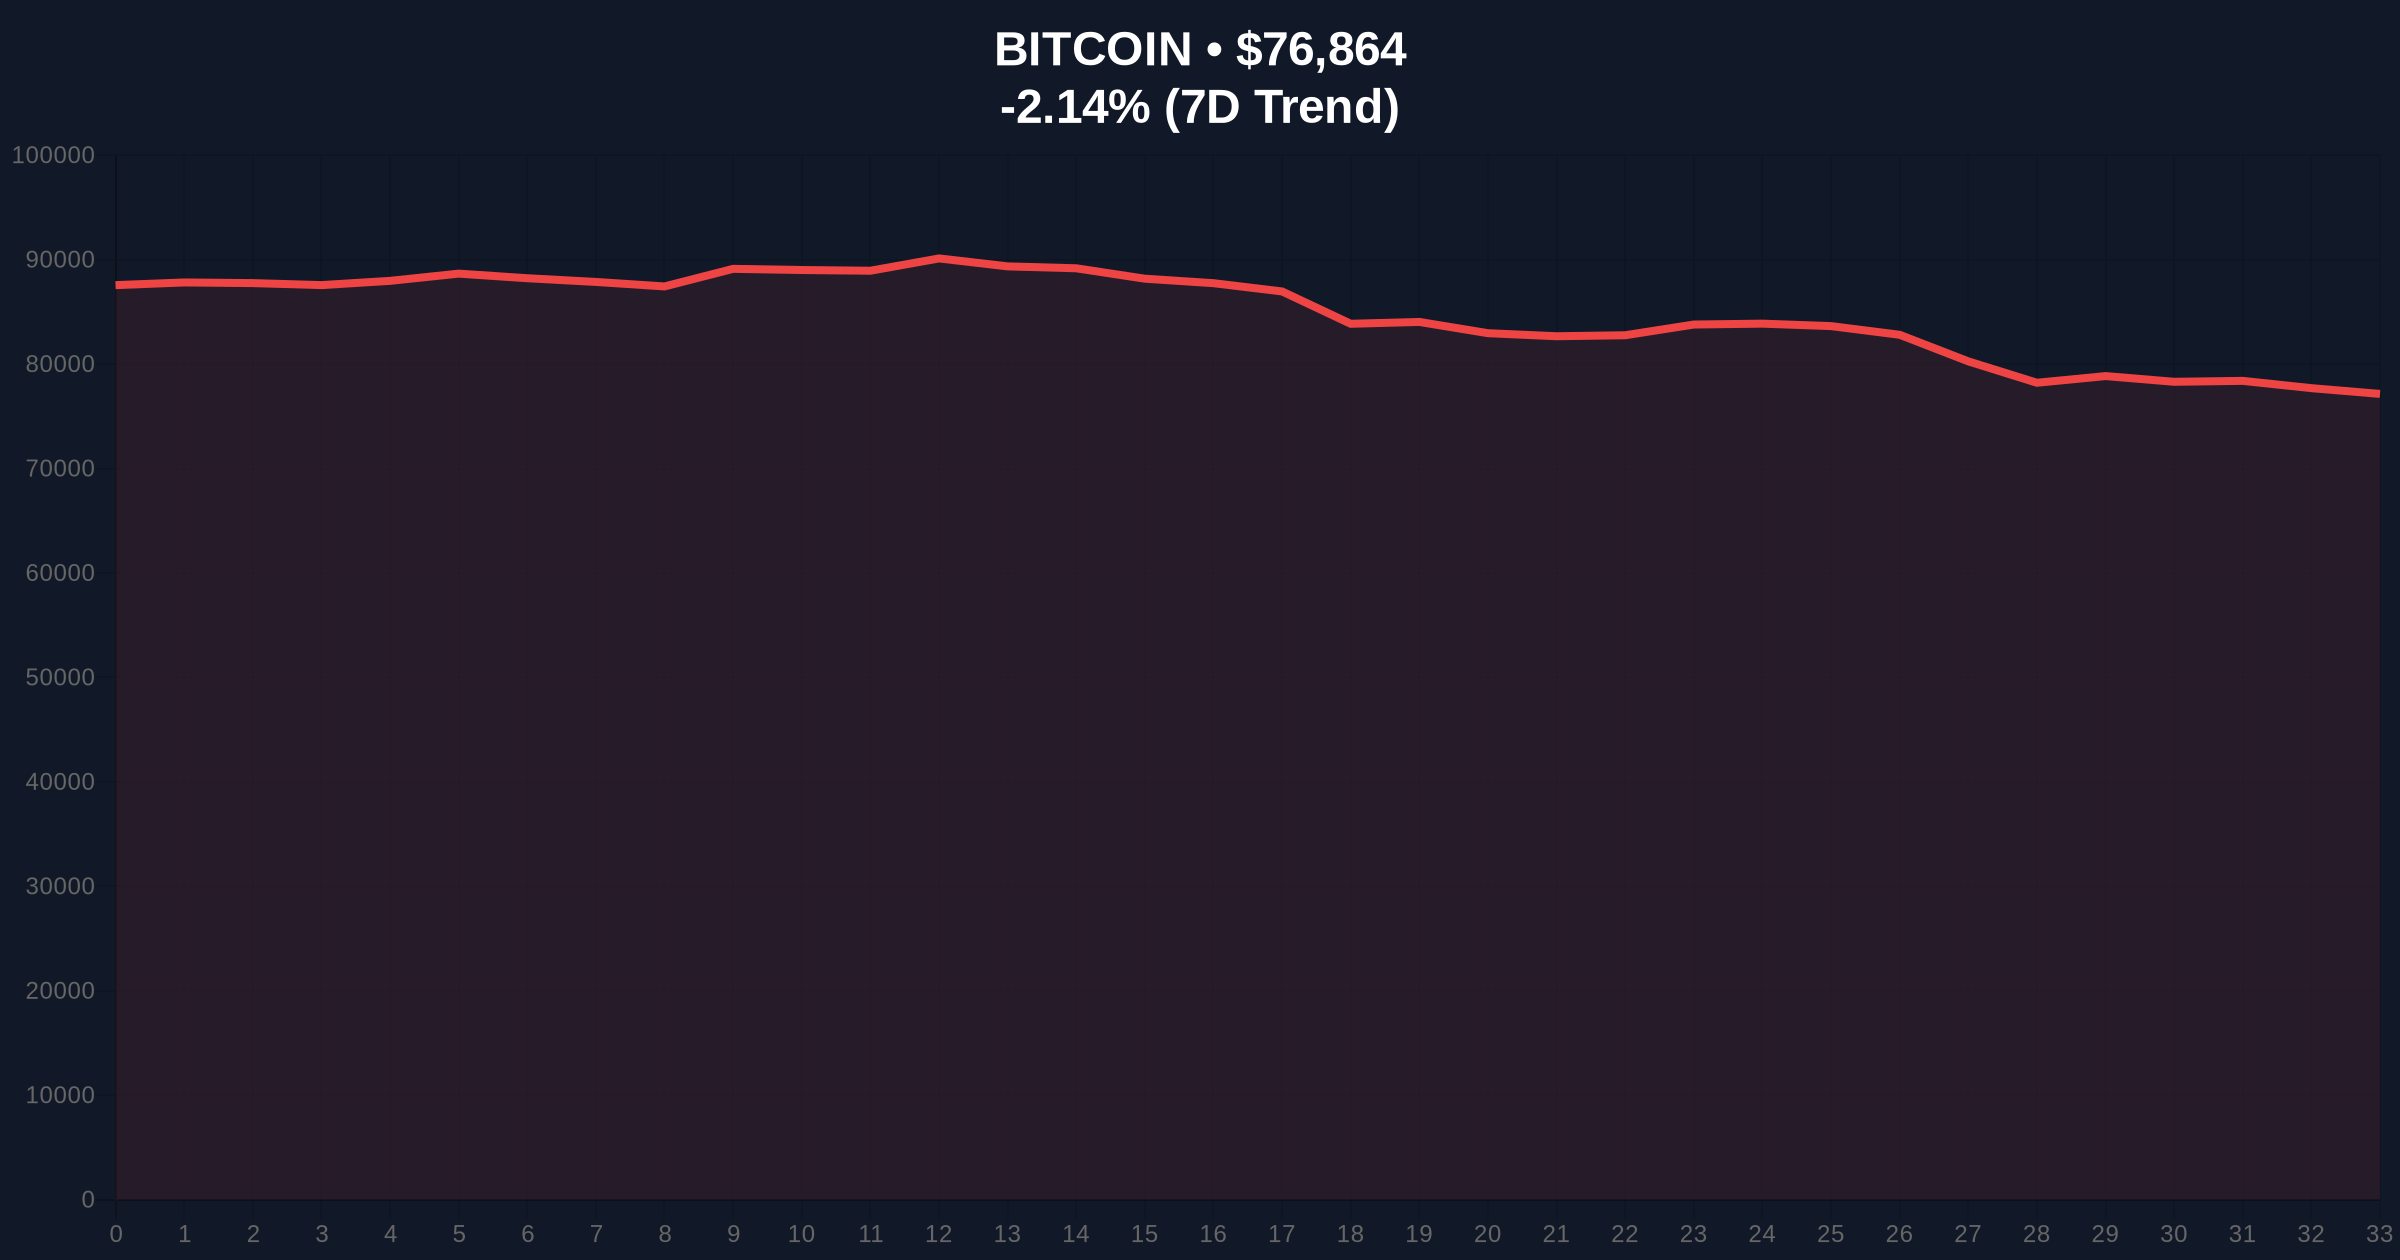
CoinNess data confirms BTC's fall below $77,000 on February 2, 2026. The asset traded at $76,948.42 on Binance's USDT pair. This price action represents a clear break of a key psychological and technical support zone. Consequently, on-chain liquidity maps from Glassnode indicate increased selling pressure from short-term holders. The 24-hour trend shows a -1.98% drop, accelerating from earlier consolidation phases.
Underlying this trend, volume profile analysis reveals a significant Fair Value Gap (FVG) between $77,500 and $78,200. This gap now acts as immediate resistance. Market analysts attribute the move to a combination of macro uncertainty and technical breakdowns. The break below $77,000 invalidated a prior order block that had supported prices since late January.
Historically, Bitcoin price action during Extreme Fear periods often precedes volatile reversals. The current sentiment score of 14/100 mirrors levels seen during the March 2020 crash and the June 2022 deleveraging event. In contrast to 2021's bull run, institutional inflows have slowed, as evidenced by recent ETF outflows. This shift reflects changing capital allocation strategies amid rising interest rates.
, related developments highlight broader market stress. For instance, BlackRock's IBIT ETF has seen average investor returns turn negative, signaling retail capitulation. Similarly, LD Capital's $70 million ETH liquidation points to institutional de-leveraging. These events compound the selling pressure on BTC.
Market structure suggests Bitcoin price action is testing critical Fibonacci retracement levels. The 0.618 Fibonacci support from the 2025 low to the 2026 high sits at $75,200. This level aligns with a high-volume node in the Volume Profile, making it a zone. The 50-day moving average at $78,500 now acts as dynamic resistance. RSI readings hover near 30, indicating oversold conditions but not yet extreme capitulation.
Additionally, the CME Bitcoin futures market shows significant gaps, with a recent $6.8K gap being the second largest on record. These gaps often fill, creating short-term volatility. On-chain data from Etherscan indicates increased movement from whale addresses, suggesting distribution. The UTXO age bands show a rise in coins aged 3-6 months moving, typical of profit-taking.
| Metric | Value |
|---|---|
| Current BTC Price | $76,992 |
| 24-Hour Change | -1.98% |
| Crypto Fear & Greed Index | 14/100 (Extreme Fear) |
| Market Rank | #1 |
| Key Support (Fibonacci 0.618) | $75,200 |
This Bitcoin price action matters because it tests institutional conviction. A break below $77,000 challenges the thesis that ETFs provide perpetual support. According to the Federal Reserve's monetary policy reports, rising real yields pressure risk assets like Bitcoin. Consequently, portfolio managers may reallocate from crypto to treasuries. Retail market structure shows increased panic selling, as seen in social sentiment metrics.
, the move impacts derivative markets. Liquidations cascade when key levels break, exacerbating volatility. Historical cycles suggest that Extreme Fear periods often mark local bottoms, but only if support holds. The 5-year horizon depends on Bitcoin maintaining its store-of-value narrative amid macro headwinds. Institutional liquidity cycles, as detailed in Ethereum's official economic models, show correlation with BTC's price action during stress events.
Market structure indicates a liquidity grab below $77,000. The Fair Value Gap between $77,500 and $78,200 must be filled for any bullish reversal. On-chain data shows whale accumulation slowing, which typically precedes deeper corrections. We monitor the $75,200 Fibonacci level as a make-or-break zone for the medium-term trend.
— CoinMarketBuzz Intelligence Desk
Market analysts outline two primary scenarios based on current Bitcoin price action. First, a bullish reversal requires reclaiming $78,500 (the 50-day MA) and filling the FVG. Second, a bearish continuation targets the $75,200 support. Historical volatility patterns suggest a resolution within 2-3 weeks.
The 12-month institutional outlook remains cautious. ETF flows need to stabilize for sustained recovery. Macro factors like Fed policy will dictate capital rotation. Consequently, Bitcoin's role as a macro hedge faces its sternest test since the 2022 cycle.

Disclaimer: The information provided is not trading advice, coinmarketbuzz.com holds no liability for any investments made based on the information provided on this page. We strongly recommend independent research and/or consultation with a qualified professional before making any investment decisions.
coinmarketbuzz.com leverages advanced AI technology to analyze market data. All content is fact-checked and reviewed by our editorial team to ensure accuracy and neutrality.


