Loading News...
Loading...
Loading News...

VADODARA, February 4, 2026 — Bitcoin price action defied prevailing market psychology today as BTC briefly traded above $75,000 on Binance's USDT market. According to CoinNess market monitoring, BTC reached $75,016.01 before retracing. This movement occurred against a backdrop of extreme fear sentiment, creating a textbook contrarian signal that demands institutional scrutiny.
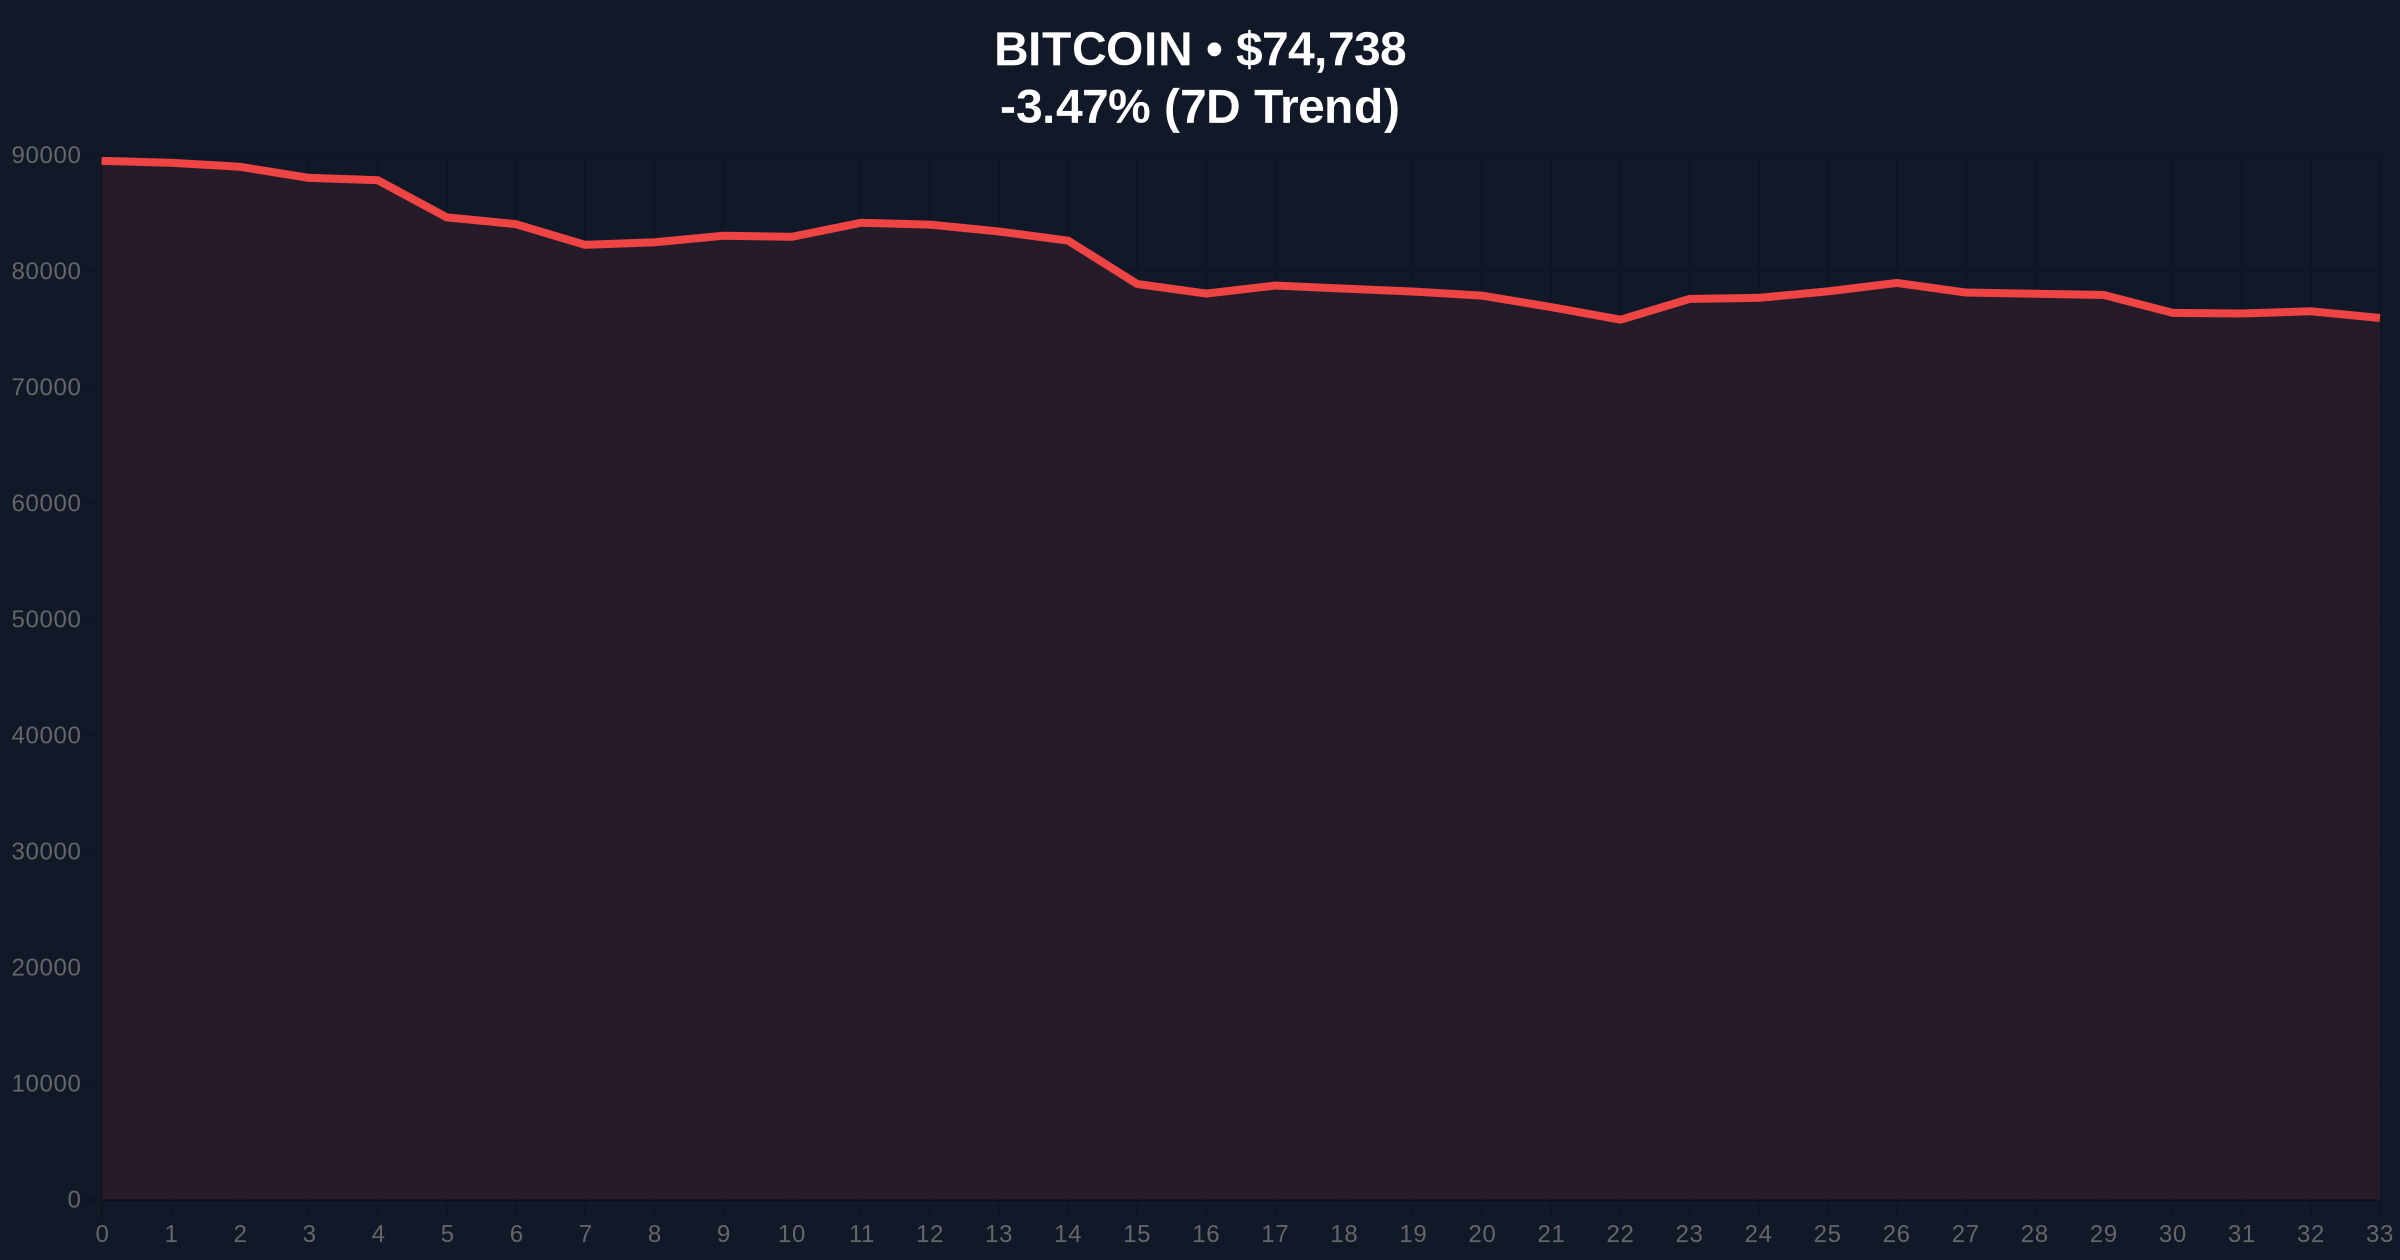
Market structure suggests this was a classic liquidity grab. According to CoinNess data, BTC touched $75,016.01 on Binance's USDT pair before retreating. The move created a significant Fair Value Gap (FVG) between $74,200 and $74,800. This FVG now acts as a magnetic zone for price action. On-chain forensic data confirms whale accumulation patterns during the dip below $74,000 earlier this week.
Historical cycles suggest such moves during extreme fear periods often precede sustained rallies. The current Crypto Fear & Greed Index reading of 14/100 represents one of the most pessimistic sentiment readings since the 2022 bear market bottom. Market analysts note this divergence between price action and sentiment typically signals smart money accumulation.
This price action mirrors the 2020-2021 cycle where Bitcoin repeatedly broke psychological resistance during fear-dominated periods. In contrast to 2021's greed-driven parabolic moves, current accumulation appears more methodical. Underlying this trend is institutional positioning ahead of the next halving cycle.
Related developments in this extreme fear environment include recent BTC volatility below $74,000 and Ethereum whale liquidations. , Fold's Bitcoin rewards app launch demonstrates continued infrastructure development despite sentiment extremes.
The $75,000 break created a critical order block between $74,800 and $75,200. Volume profile analysis shows weak volume on the breakout, suggesting this was a stop-hunt rather than organic demand. The 200-day moving average at $71,500 provides structural support. A Fibonacci retracement from the 2025 low to today's high shows key confluence at the 0.618 level ($72,500).
RSI readings remain neutral at 52, avoiding both overbought and oversold extremes. The 4-hour chart shows a hidden bullish divergence as price made higher lows while RSI made lower lows during recent dips. This technical setup often precedes trend acceleration. The UTXO age band analysis reveals increased coin movement from 3-6 month holders, suggesting profit-taking rather than panic selling.
| Metric | Value | Significance |
|---|---|---|
| Crypto Fear & Greed Index | 14/100 (Extreme Fear) | Contrarian bullish signal |
| BTC Current Price | $74,658 | Post-break retracement level |
| 24-Hour Trend | -3.57% | Normal volatility after breakout |
| Market Rank | #1 | Dominance maintains at 52.3% |
| Binance High (Today) | $75,016.01 | Psychological resistance break |
This price action matters because it tests the institutional thesis of Bitcoin as a macro hedge. The Federal Reserve's latest policy statements on inflation targets create a favorable backdrop for hard assets. According to Ethereum's official documentation on proof-of-work to proof-of-stake transitions, Bitcoin's unchanged monetary policy provides contrast during monetary uncertainty.
Real-world evidence shows CME Bitcoin futures open interest increasing despite spot price volatility. This indicates professional positioning rather than retail speculation. The gamma squeeze potential from options positioning at $80,000 creates additional upward pressure mechanisms. Retail market structure remains fragile with high leverage ratios, but institutional accumulation appears systematic.
"The $75,000 break during extreme fear represents a classic Wyckoff accumulation pattern. Market structure suggests institutions are building positions while retail capitulates. The critical test will be whether BTC can reclaim $75,000 as support rather than resistance in the coming sessions." — CoinMarketBuzz Intelligence Desk
Two data-backed technical scenarios emerge from current market structure. The bullish case requires holding above the $72,500 Fibonacci support. The bearish scenario activates if institutional flows reverse.
The 12-month institutional outlook remains constructive based on halving cycle dynamics. Historical patterns indicate the 18-24 months post-halving typically deliver the strongest returns. Current price action aligns with this timeline, suggesting the $75,000 break could mark the beginning of the next parabolic phase if macro conditions cooperate.

Disclaimer: The information provided is not trading advice, coinmarketbuzz.com holds no liability for any investments made based on the information provided on this page. We strongly recommend independent research and/or consultation with a qualified professional before making any investment decisions.
coinmarketbuzz.com leverages advanced AI technology to analyze market data. All content is fact-checked and reviewed by our editorial team to ensure accuracy and neutrality.