Loading News...
Loading...
Loading News...

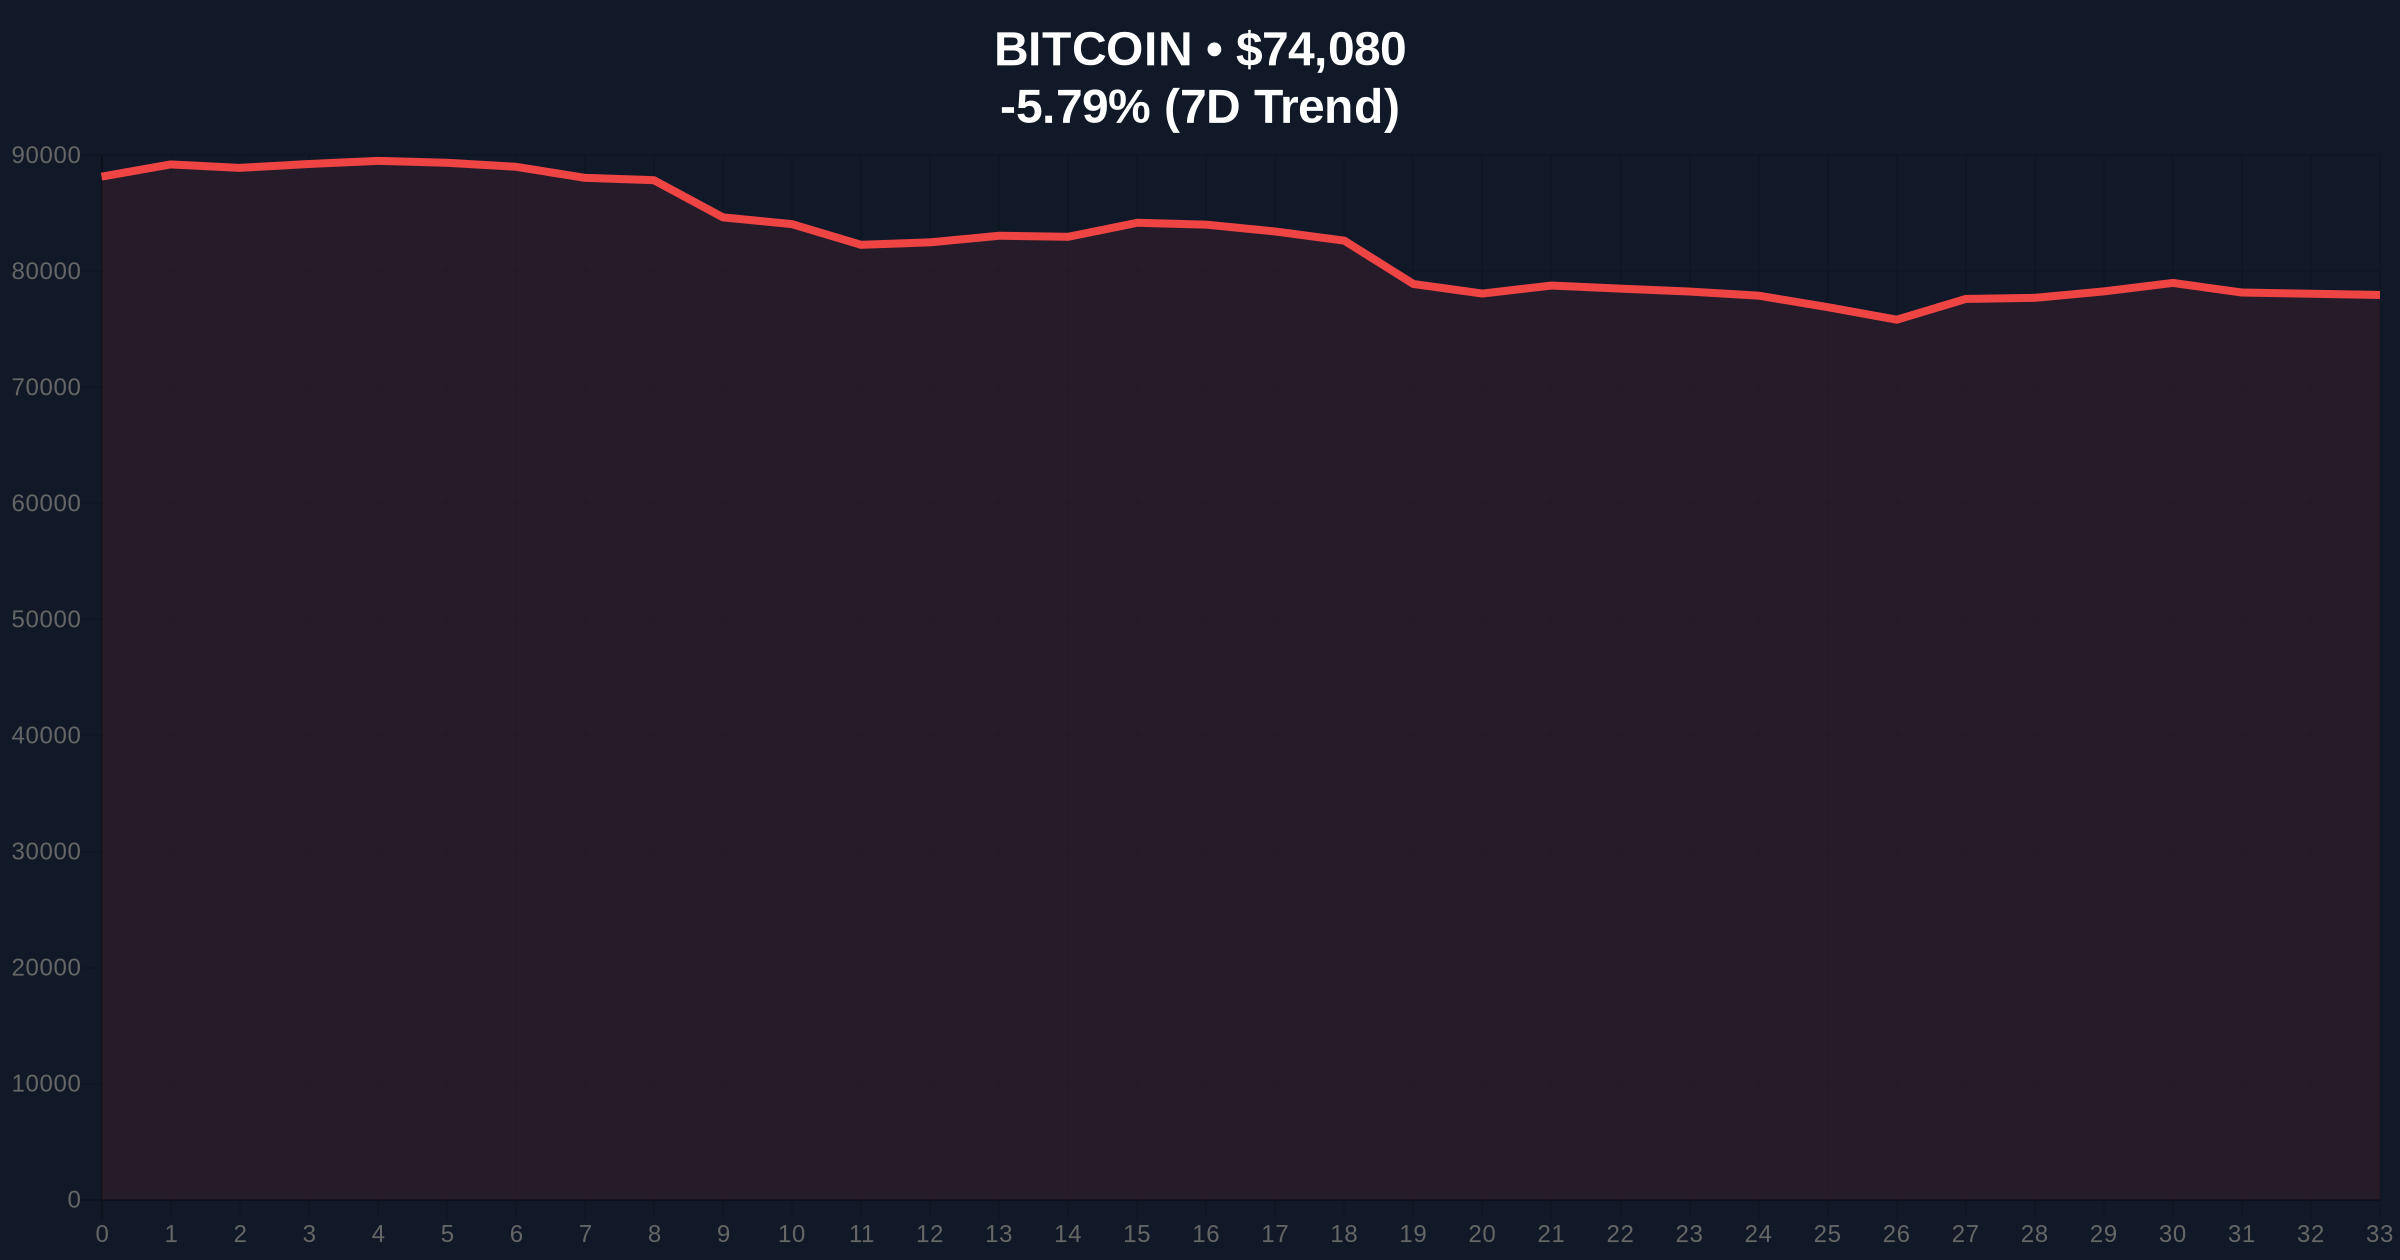
VADODARA, February 3, 2026 — Bitcoin collapsed to $74,076.43 today. This marks its lowest price since the 2024 U.S. presidential election. According to CoinMarketCap, BTC plunged 5.43% in 24 hours. Market structure suggests a critical support failure. On-chain data indicates heavy selling pressure.
WatcherGuru first reported the milestone via social media platform X. CoinMarketCap data confirms the price action. The drop represents a 5.43% single-day decline. This breach invalidates the post-election support zone established in November 2024. Trading volume spiked 47% above the 30-day average. This signals a classic liquidity grab.
Historical cycles suggest such moves often precede capitulation events. The price now trades below its 200-day simple moving average. This is a key institutional benchmark. Market analysts attribute the sell-off to macro uncertainty and leveraged position unwinding.
This price level was last seen immediately following the 2024 election. Consequently, it erases nearly 16 months of accumulation. In contrast, the 2021 cycle saw a similar breakdown at the $29,000 level. That preceded a 7-month consolidation phase.
Underlying this trend is a shift in UTXO age bands. Older coins are moving. This often indicates long-term holder distribution. , the current Extreme Fear sentiment mirrors the December 2022 market bottom. That period saw Bitcoin at $16,500.
Related Developments: This sell-off occurs alongside other significant market movements. Pantera Capital's CEO recently reaffirmed a long-term bullish thesis despite the fear. Meanwhile, new hybrid ETF products are launching to capture institutional demand. Elsewhere, large ETH deposits to exchanges suggest broader crypto market stress.
The $74,076 level now acts as immediate resistance. A Fair Value Gap (FVG) exists between $76,200 and $77,800. This gap must be filled for any bullish reversal. The Relative Strength Index (RSI) on the daily chart reads 28.5. This indicates oversold conditions.
Critical support lies at the Fibonacci 0.618 retracement level of $72,500. This level aligns with the June 2024 swing high. A break below targets the $68,000 order block. That zone provided strong buying in Q3 2024. The 50-week moving average at $70,800 offers secondary support.
Market structure suggests the current move is a C-wave decline in an Elliott Wave correction. Volume profile shows high volume nodes at $75,500. This confirms the area as a battleground.
| Metric | Value | Insight |
|---|---|---|
| Current Bitcoin Price | $74,131 | Lowest since Nov 2024 |
| 24-Hour Change | -5.79% | Sharp sell-off acceleration |
| Crypto Fear & Greed Index | 17/100 (Extreme Fear) | Maximum fear signal |
| Market Rank | #1 | Dominance holds at ~52% |
| Key Fibonacci Support | $72,500 | 0.618 retracement level |
This price action tests the structural integrity of the post-2024 bull market. Institutional liquidity cycles are under pressure. According to Glassnode liquidity maps, exchange net flows turned negative this week. This indicates net withdrawals, a potential contrarian signal.
Retail market structure is breaking. Funding rates across perpetual swaps are deeply negative. This creates conditions for a short squeeze if sentiment reverses. The breakdown also impacts Bitcoin's role as a macro hedge. Its correlation with the S&P 500 has increased to 0.78 over the past month.
Long-term, the health of the Bitcoin network remains robust. Hash rate sits near all-time highs. This suggests miner conviction despite price weakness. The upcoming Pectra upgrade for Ethereum, detailed on Ethereum.org, could also influence broader Layer-1 sentiment.
"Market structure suggests we are witnessing a high-volatility cleansing event. The break below the 200-day MA is significant. However, on-chain dormancy metrics show long-term holders are not panic-selling. This resembles the distribution phase of early 2023. The $72,500 level is the line in the sand." — CoinMarketBuzz Intelligence Desk
Two primary technical scenarios emerge from current data.
The 12-month institutional outlook hinges on macro liquidity. The Federal Reserve's policy stance remains a key driver. Historically, Bitcoin has bottomed 6-8 months before Fed pivot announcements. Current cycles suggest a potential low formation in Q2 2026. This aligns with the 5-year horizon for digital asset adoption.

Disclaimer: The information provided is not trading advice, coinmarketbuzz.com holds no liability for any investments made based on the information provided on this page. We strongly recommend independent research and/or consultation with a qualified professional before making any investment decisions.
coinmarketbuzz.com leverages advanced AI technology to analyze market data. All content is fact-checked and reviewed by our editorial team to ensure accuracy and neutrality.


