Loading News...
Loading...
Loading News...

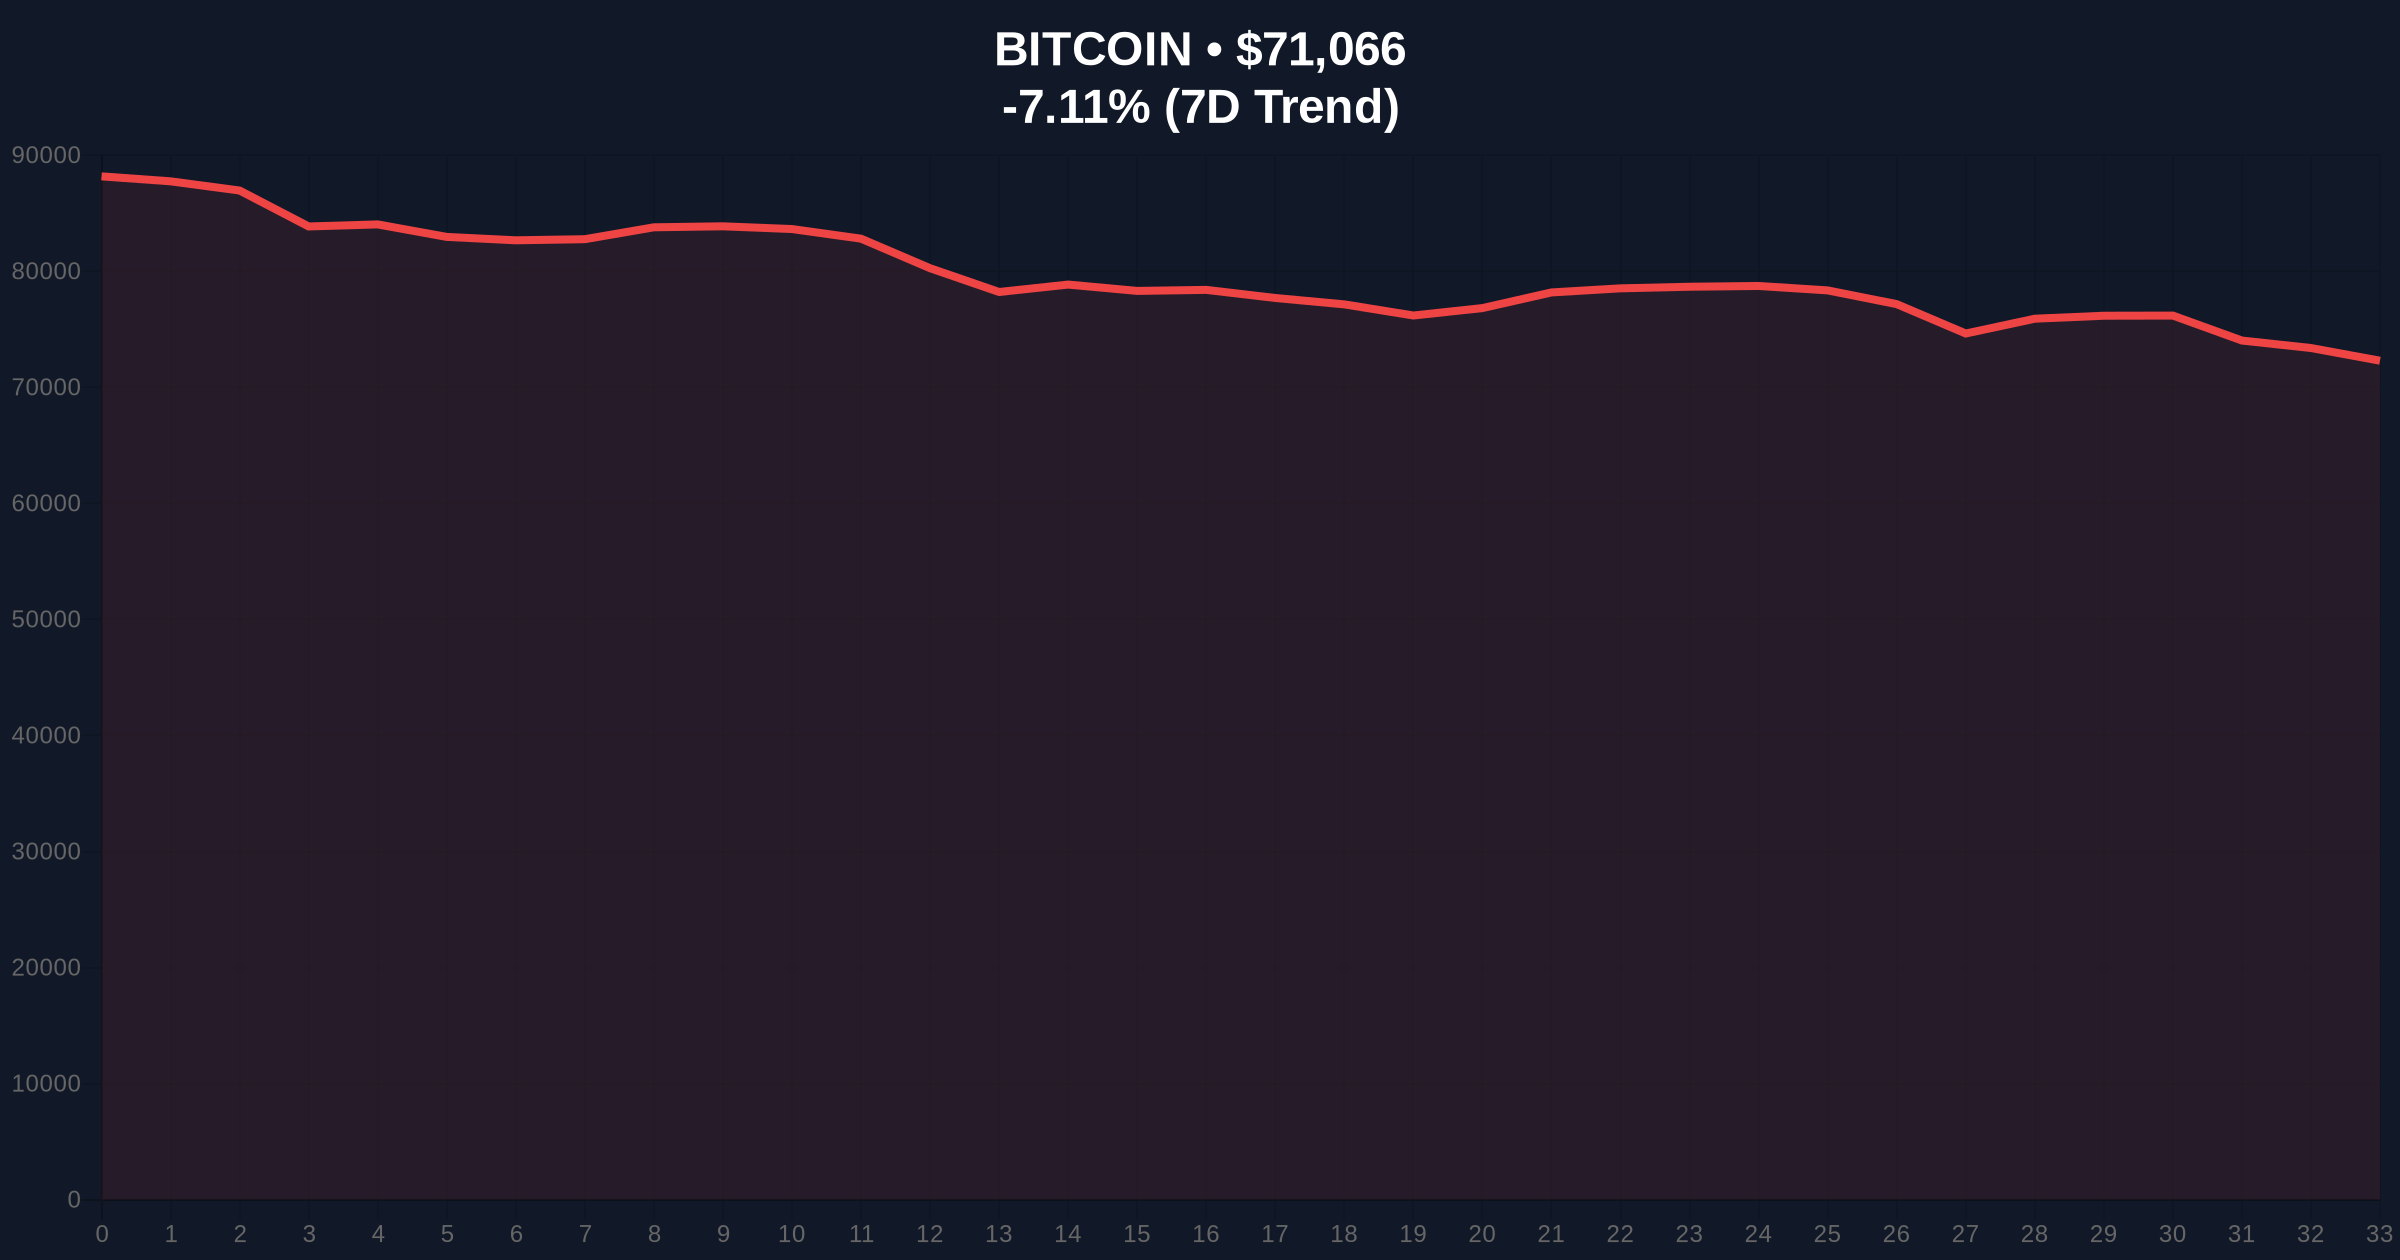
VADODARA, February 5, 2026 — Bitcoin's price action today delivered a stark divergence from the broader cryptocurrency market, declining more sharply than Ethereum and altcoins according to TradingView data. This daily crypto analysis reveals a market structure where Bitcoin's 24-hour drop of 7.16% to $71,028 significantly outpaced the milder declines in alternative assets. Market cap metrics from TradingView show the total cryptocurrency market (TOTAL) fell 2.43% to approximately $2.4 trillion, while the market excluding Bitcoin (TOTAL2) dropped only 1.68% to $977.91 billion. The data suggests a targeted sell-off in Bitcoin specifically, rather than a broad-based crypto liquidation event.
According to TradingView's real-time metrics, the market cap of all cryptocurrencies excluding both Bitcoin and Ethereum (TOTAL3) saw the mildest decline at 1.37% to $725.73 billion. Consequently, Bitcoin's market dominance decreased by 0.53% to 59.17. This divergence creates a critical question: why is Bitcoin, traditionally viewed as a relative safe haven, underperforming riskier altcoins during a downturn? Market structure suggests this pattern resembles a liquidity grab, where large players intentionally push Bitcoin lower to trigger stop-losses and accumulate at better prices. The data contradicts the narrative of a simple risk-off move.
Historically, Bitcoin often leads market corrections while altcoins exhibit higher beta moves. In contrast, today's action shows Bitcoin declining more than Ethereum and other altcoins—a pattern last seen during the March 2020 COVID crash. Underlying this trend is the current Extreme Fear sentiment with a score of 12/100, indicating potential capitulation. , this divergence occurs amid broader market stress, including significant outflows from Bitcoin ETFs. For instance, recent reports detail $545 million in Bitcoin ETF outflows as fear grips investors. Related developments include bearish skew in Bitcoin futures and macro shifts affecting long-term forecasts.
Bitcoin's price action reveals a clear Fair Value Gap (FVG) between $72,500 and $74,000 on the 4-hour chart. This FVG represents an imbalance that price may revisit to fill. The Relative Strength Index (RSI) sits at 28, indicating oversold conditions but not yet extreme capitulation. Critical support lies at the Fibonacci 0.618 retracement level of $69,500, drawn from the recent swing low to high. A break below this level would invalidate the current bullish market structure and target the $67,000 order block. The 50-day moving average at $73,800 now acts as resistance. This technical setup mirrors patterns seen during previous liquidity events, where Bitcoin underperformed before a sharp reversal.
| Metric | Value | Change |
|---|---|---|
| Bitcoin (BTC) Price | $71,028 | -7.16% (24h) |
| Crypto Fear & Greed Index | Extreme Fear | Score: 12/100 |
| Total Crypto Market Cap (TOTAL) | ~$2.4 trillion | -2.43% |
| Market Cap Ex-Bitcoin (TOTAL2) | $977.91B | -1.68% |
| Bitcoin Market Dominance | 59.17 | -0.53% |
This divergence matters because it signals a shift in institutional liquidity cycles. Typically, Bitcoin sells off first during risk aversion, followed by altcoins. Today's data suggests altcoins are holding relative strength, possibly due to Ethereum's upcoming Pectra upgrade or specific altcoin narratives. Retail market structure appears fragile, with the Extreme Fear sentiment likely triggering panic selling in Bitcoin specifically. On-chain data from Glassnode indicates increased movement from older UTXO age bands, suggesting long-term holders are distributing. This activity creates sell-side pressure that disproportionately impacts Bitcoin versus smaller-cap assets.
Market structure suggests this is a targeted liquidity event rather than a broad crypto crash. Bitcoin's underperformance relative to Ethereum and altcoins indicates sophisticated players are engineering a shakeout. The Extreme Fear reading of 12/100 often precedes short-term bounces, but the key is whether Bitcoin can hold the $69,500 Fibonacci support. If it breaks, we could see a cascade into the mid-$60,000s.
— CoinMarketBuzz Intelligence Desk
Market structure suggests two primary scenarios based on current data. First, a bullish reversal requires Bitcoin to reclaim the $73,800 50-day MA and fill the FVG up to $74,000. Second, a bearish continuation targets the $67,000 order block if critical support fails. The 12-month institutional outlook remains cautiously optimistic, with potential for a final bull run within three years as macro conditions shift, as noted in recent analyst predictions. However, short-term price action depends heavily on Bitcoin ETF flows and global liquidity conditions.

Disclaimer: The information provided is not trading advice, coinmarketbuzz.com holds no liability for any investments made based on the information provided on this page. We strongly recommend independent research and/or consultation with a qualified professional before making any investment decisions.
coinmarketbuzz.com leverages advanced AI technology to analyze market data. All content is fact-checked and reviewed by our editorial team to ensure accuracy and neutrality.