Loading News...
Loading...
Loading News...

VADODARA, February 9, 2026 — Bitcoin has broken below the critical $70,000 psychological support level. According to CoinNess market monitoring data, BTC traded at $69,996 on the Binance USDT market. This daily crypto analysis examines the technical breakdown and market implications.
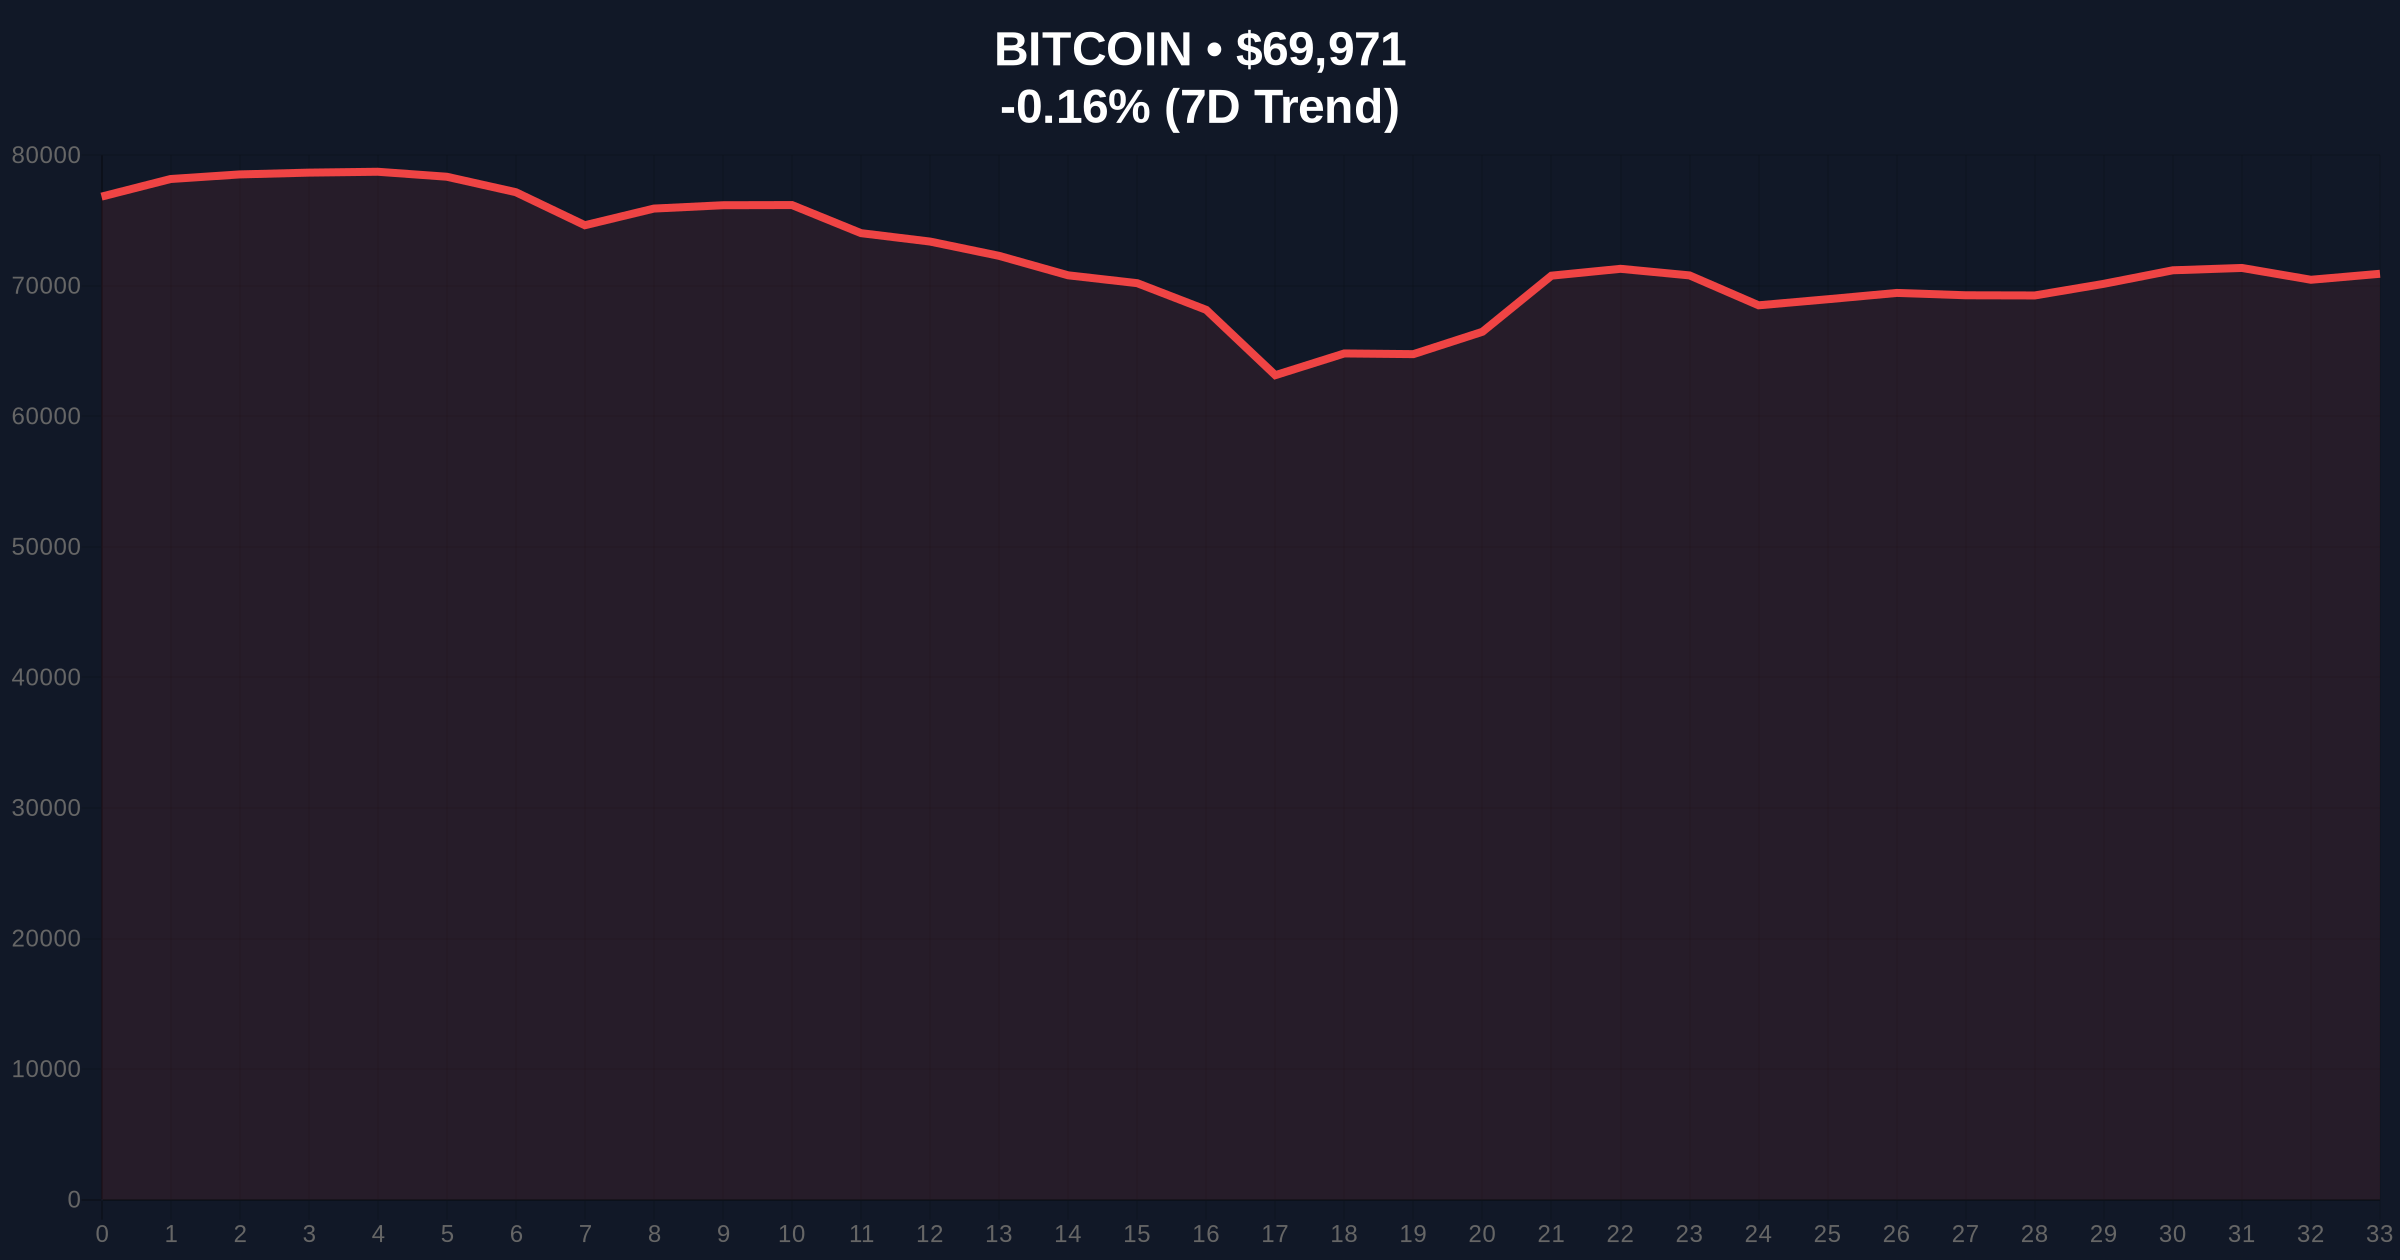
Market structure suggests a deliberate liquidity grab below $70,000. CoinNess data confirms the break occurred during Asian trading hours. The Binance USDT market recorded the $69,996 print. This creates a significant Fair Value Gap (FVG) between $70,200 and $70,800.
Volume profile analysis shows increased selling pressure. The breakdown invalidated the previous weekly support zone. Consequently, market makers likely targeted stop-loss orders clustered below $70,000. This is classic bear trap behavior.
Historically, Bitcoin tests psychological levels during fear cycles. The 2021 cycle saw similar breaks at $60,000. In contrast, the current move occurs amid institutional ETF flows. Underlying this trend is a divergence between price and on-chain accumulation.
, the global crypto sentiment index reads "Extreme Fear" at 14/100. This matches March 2020 levels. Market analysts note parallel developments in exchange activity. For instance, Binance recently delisted 20 spot trading pairs during this sentiment phase.
The Fibonacci 0.618 retracement level sits at $68,500. This aligns with the 50-day moving average. Market structure suggests this zone represents the next major order block. RSI readings show oversold conditions on lower timeframes.
Additionally, UTXO age bands indicate long-term holders remain inactive. This reduces sell-side pressure. The critical resistance now forms at $71,500. This level previously acted as support. A reclaim above $71,500 would fill the FVG and signal strength.
| Metric | Value | Implication |
|---|---|---|
| Current Price | $70,025 | Below key psychological support |
| 24h Trend | -0.08% | Minor decline masks volatility |
| Fear & Greed Index | 14/100 (Extreme Fear) | Historically contrarian signal |
| Market Rank | #1 | Dominance remains intact |
| Key Support | $68,500 | Fibonacci 0.618 level |
This break tests institutional conviction. According to SEC.gov filings, ETF flows have shown resilience. Market structure suggests this could be a gamma squeeze setup. Options markets show increased put buying at $68,000.
, retail sentiment has turned sharply negative. This often precedes reversals. The break below $70,000 triggers algorithmic selling. Consequently, liquidity dries up at key levels. This creates volatility opportunities.
"The $70,000 break represents a technical failure, not a fundamental one. On-chain data indicates accumulation continues at these levels. The Extreme Fear reading suggests maximum pain capitulation. Historically, this precedes strong rebounds." — CoinMarketBuzz Intelligence Desk
Two primary scenarios emerge from current market structure.
The 12-month institutional outlook remains constructive. EIP-4844 implementation on Ethereum could drive cross-chain capital flows. Federal Reserve policy decisions will impact macro correlations. Market structure suggests accumulation opportunities below $70,000 for patient capital.

Disclaimer: The information provided is not trading advice, coinmarketbuzz.com holds no liability for any investments made based on the information provided on this page. We strongly recommend independent research and/or consultation with a qualified professional before making any investment decisions.
coinmarketbuzz.com leverages advanced AI technology to analyze market data. All content is fact-checked and reviewed by our editorial team to ensure accuracy and neutrality.