Loading News...
Loading...
Loading News...

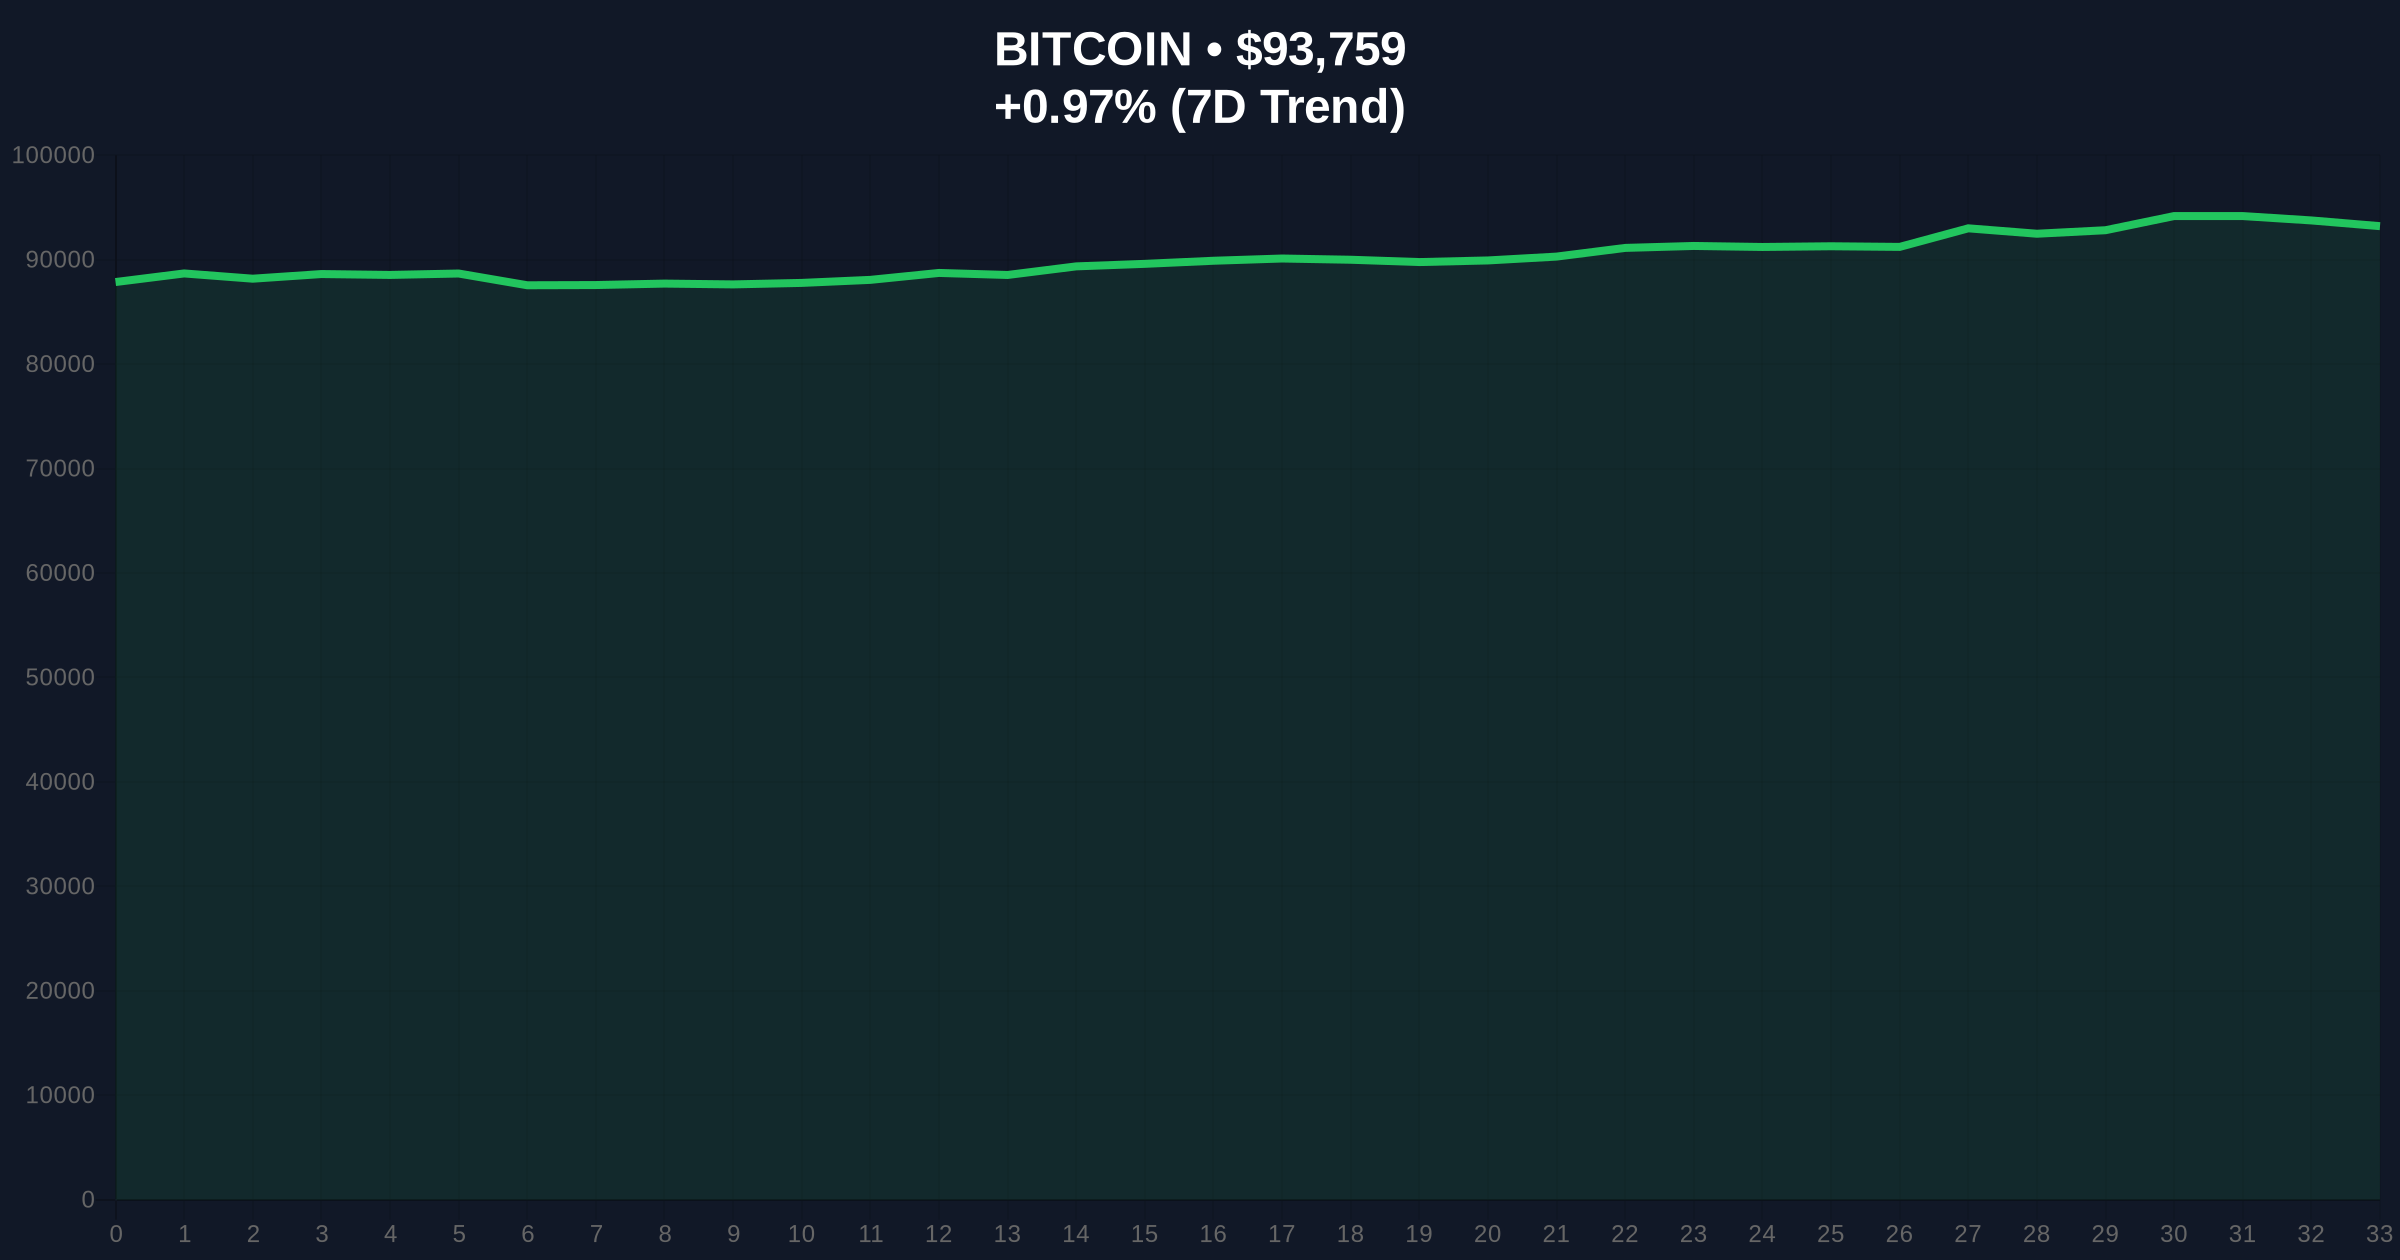
VADODARA, January 6, 2026 — According to on-chain analytics firm Glassnode, Bitcoin's current funding rate structure fails to meet historical thresholds for a decisive bullish reversal, creating a critical divergence between price action and derivative market sentiment in this daily crypto analysis. The firm's X post reveals that while BTC trades at $93,756, the seven-day moving average for perpetual futures funding rates remains at approximately 0.003%, well below the 0.01% level that typically precedes sustained upward momentum.
Market structure suggests Bitcoin's current position represents a classic liquidity grab above the $90,000 psychological level. Historical cycles indicate that bull markets require coordinated momentum across spot, futures, and options markets—a condition not yet met according to Glassnode's data. This mirrors the 2021 cycle where funding rates remained subdued during consolidation phases before explosive moves. The current environment follows what some analysts describe as a macro-driven rally to $93k, yet derivative metrics question its sustainability. Related developments include institutional filings signaling potential liquidity accumulation and macro indicators suggesting longer-term bullish setups.
Glassnode's analysis, based on real-time exchange data from major centralized platforms, shows Bitcoin funding rates experienced a recent dip to around 0% before rebounding to 0.005%. The metric has since stabilized at approximately 0.003% over the past 24 hours. According to the firm's statement, this represents a modest upward trend but remains insufficient for confirming trend reversal. The data indicates that while the market environment appears favorable with neutral-to-positive funding, it lacks the sustained elevation above 0.01% that historically accompanies strong uptrends. This creates what technical analysts might identify as a Fair Value Gap (FVG) between current price levels and derivative market conviction.
On-chain data indicates Bitcoin currently tests the upper boundary of its recent consolidation range between $88,000 and $94,500. The Relative Strength Index (RSI) sits at 58, suggesting neutral momentum without overbought conditions. The 50-day moving average provides dynamic support at $89,200, while the 200-day moving average establishes longer-term support at $82,000. Volume profile analysis shows significant accumulation between $90,000 and $92,000, creating a potential order block for future price action. Bullish invalidation occurs below $90,500, where the market would lose its recent higher low structure. Bearish invalidation requires a sustained break above $95,000 with accompanying volume expansion. The Fibonacci retracement from the 2025 low to current levels shows key resistance at $96,800 (61.8% level).
| Metric | Value | Significance |
|---|---|---|
| Current BTC Price | $93,756 | Testing upper consolidation range |
| 24-Hour Change | +0.94% | Modest upward momentum |
| Crypto Fear & Greed Index | 44/100 (Fear) | Contradicts price stability |
| Funding Rate (7D MA) | ~0.003% | Below bull run threshold of 0.01% |
| Market Rank | #1 | Maintains dominance position |
For institutional investors, this funding rate divergence suggests caution in deploying capital despite price stability. The Federal Reserve's monetary policy documentation indicates that derivative market sentiment often leads spot price action by 2-3 weeks. Retail traders face increased risk of false breakouts if funding rates don't confirm price movements. The discrepancy creates what quantitative models identify as a gamma squeeze setup, where options market dynamics could amplify volatility in either direction. Market structure suggests institutions may be accumulating at current levels while retail sentiment remains fearful, creating potential for a liquidity-driven move once funding rates align with price action.
Market analysts on X express divided views. Some bulls point to the neutral funding environment as healthy for sustainable growth, avoiding the excessive leverage that typically precedes corrections. Bears highlight the failure to reach historical bull market thresholds as evidence of underlying weakness. According to on-chain forensic data from platforms like Bubblemaps, wallet activity shows accumulation by large holders but without corresponding derivative market enthusiasm. The consensus remains skeptical of immediate bullish continuation until funding rates demonstrate sustained elevation.
Bullish Case: If funding rates stabilize above 0.008% while price holds above $92,000, market structure suggests a test of $98,000 resistance within 2-3 weeks. This scenario requires increased institutional participation and positive macro catalysts, potentially driven by developments in Ethereum's Pectra upgrade (EIP-7702) creating cross-chain momentum.
Bearish Case: Should funding rates revert to negative territory while price breaks below $90,500, on-chain data indicates a retest of $85,000 support. This would represent a classic liquidity grab failure, with the market filling the Fair Value Gap created during the recent rally. Historical patterns suggest such a move would likely find support at the 200-day moving average near $82,000.
Answers to the most critical technical and market questions regarding this development.

Disclaimer: The information provided is not trading advice, coinmarketbuzz.com holds no liability for any investments made based on the information provided on this page. We strongly recommend independent research and/or consultation with a qualified professional before making any investment decisions.
coinmarketbuzz.com leverages advanced AI technology to analyze market data. All content is fact-checked and reviewed by our editorial team to ensure accuracy and neutrality.