Loading News...
Loading...
Loading News...

VADODARA, January 9, 2026 — U.S. Bitcoin spot exchange-traded funds (ETFs) recorded a total net outflow of $400 million on January 8, marking the third consecutive day of net outflows, according to data compiled by TraderT. This daily crypto analysis examines the structural implications of sustained institutional selling pressure on Bitcoin's price action and market liquidity. The outflows were led by BlackRock's IBIT (-$194.64 million), Fidelity's FBTC (-$120.52 million), and Grayscale's GBTC (-$73.09 million), while Bitwise's BITB and WisdomTree's BTCW saw minor inflows of $2.96 million and $1.92 million, respectively.
Market structure suggests this outflow pattern mirrors the 2021 correction, where ETF redemptions preceded a 50% drawdown in Bitcoin's price. According to historical cycles, three consecutive days of net outflows typically indicate institutional profit-taking or portfolio rebalancing, often creating a Fair Value Gap (FVG) that must be filled. The current scenario parallels the post-ETF approval phase of early 2024, when initial inflows were followed by volatility as market makers adjusted positions. Similar to the 2021 correction, the dominance of large outflows from major issuers like BlackRock and Fidelity points to systematic rather than retail-driven selling. On-chain data indicates that UTXO age bands for 3-6 month holders have increased, suggesting accumulation pauses amid uncertainty.
According to TraderT's compiled data, U.S. Bitcoin spot ETFs experienced a net outflow of $400 million on January 8, 2026. BlackRock's IBIT led with -$194.64 million, followed by Fidelity's FBTC at -$120.52 million and Grayscale's GBTC at -$73.09 million. Ark Invest's ARKB and Grayscale's Mini BTC recorded outflows of $9.63 million and $7.24 million, respectively. In contrast, Bitwise's BITB and WisdomTree's BTCW saw small inflows of $2.96 million and $1.92 million. This marks the third straight day of net outflows, totaling approximately $1.1 billion over the period. The data, sourced from official ETF filings and market feeds, shows a clear shift from the accumulation phase observed in late 2025.
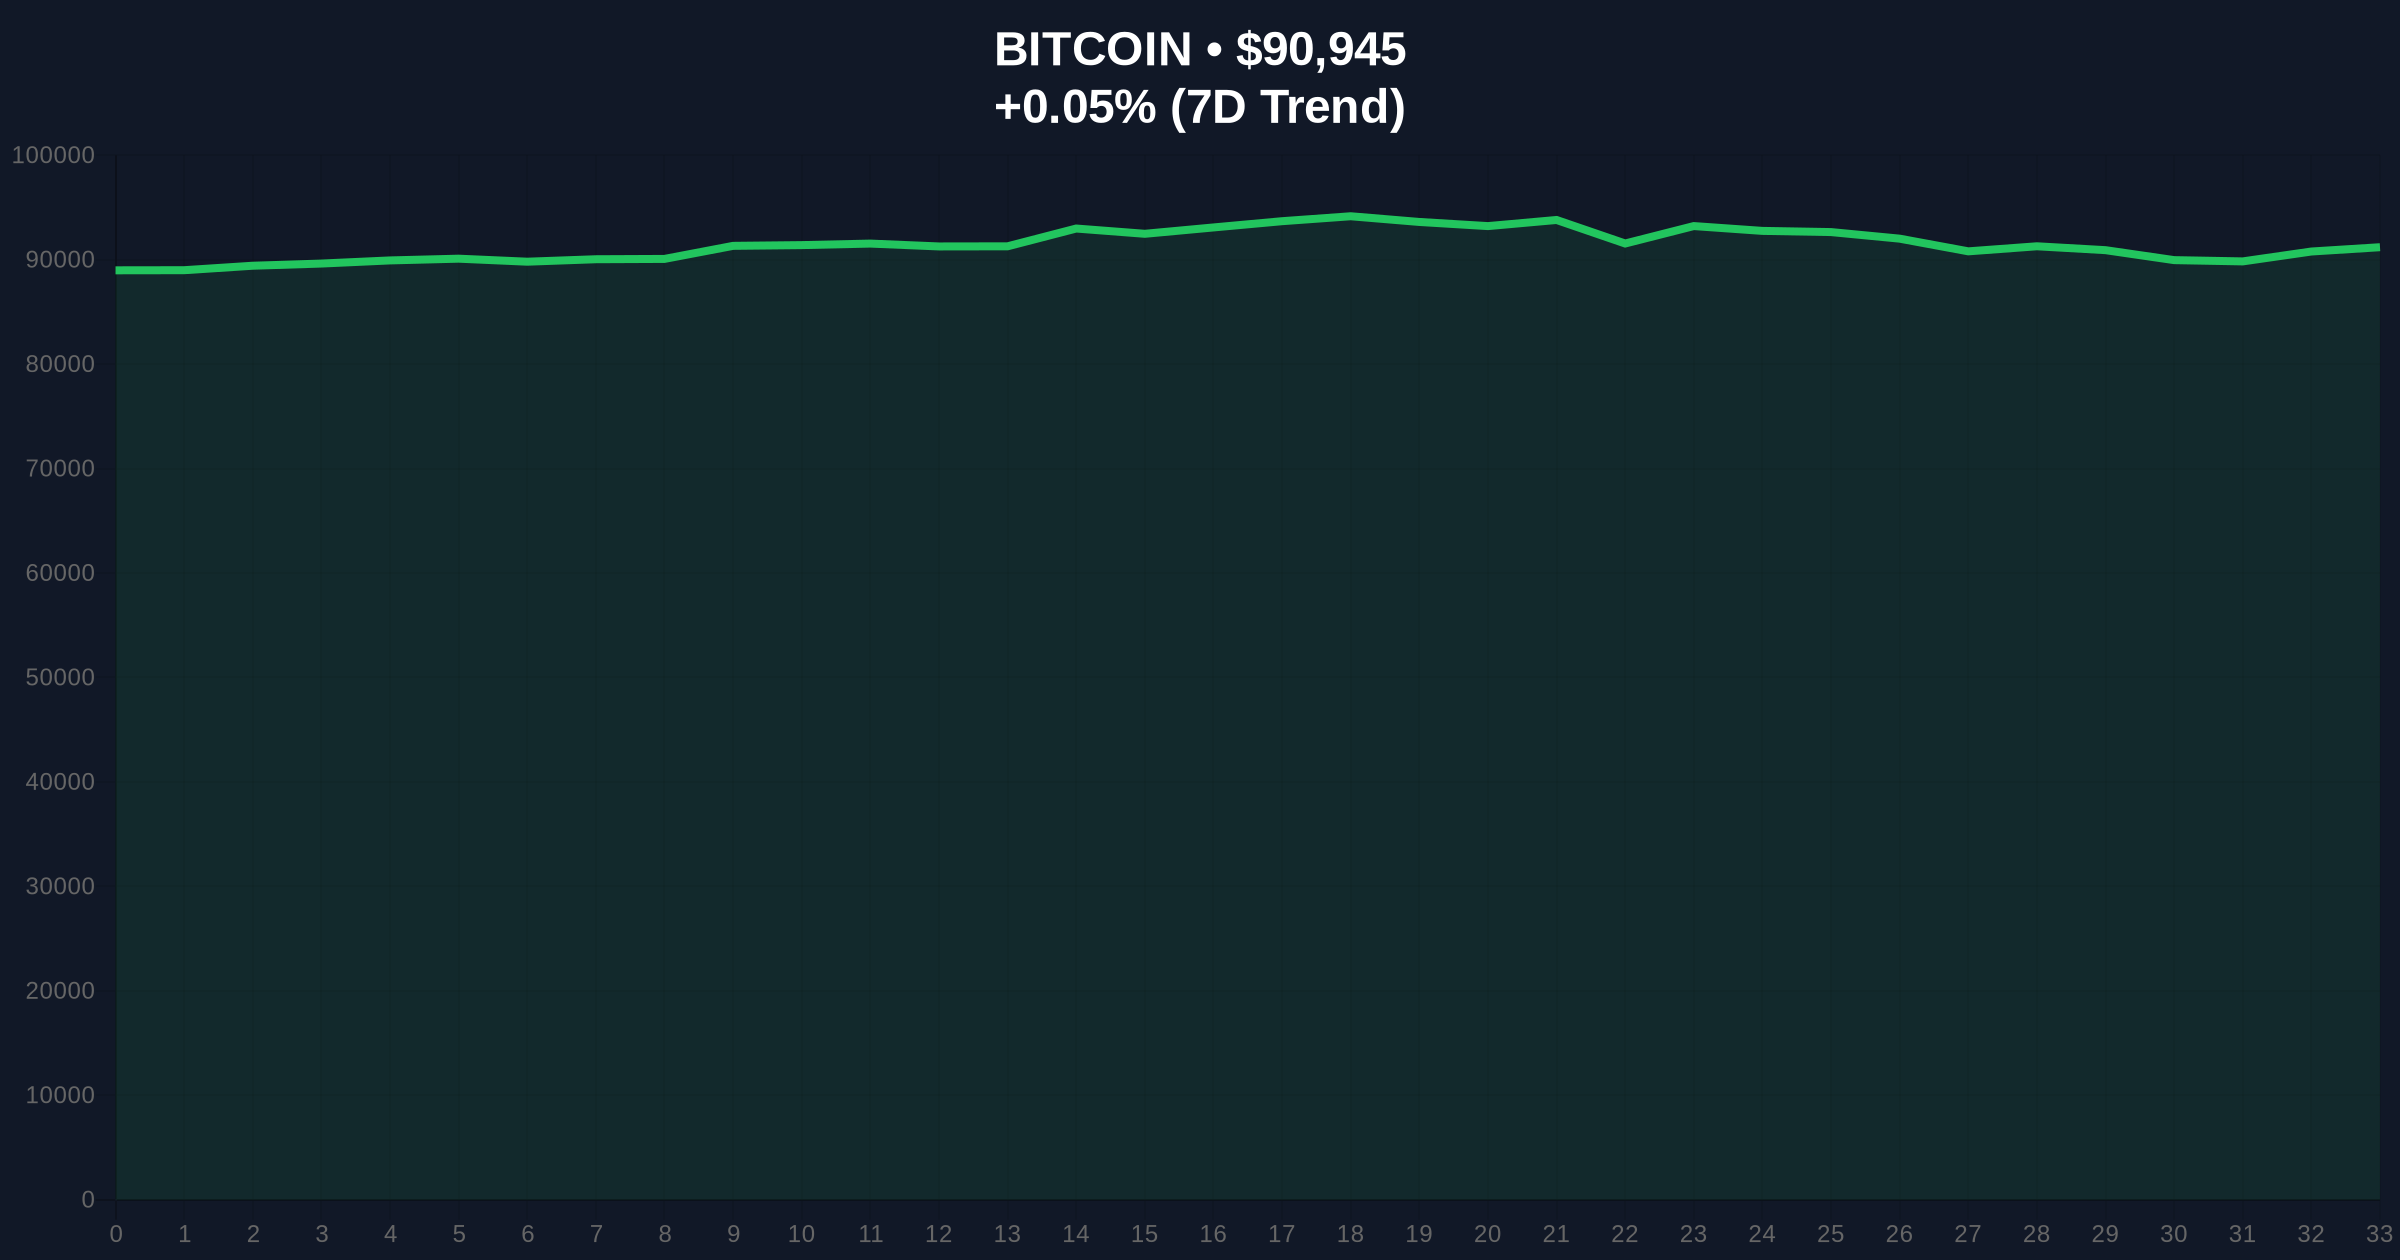
Bitcoin's price currently sits at $90,934, with a 24-hour trend of 0.04%. Market structure suggests the $92,000 level acted as a resistance order block, leading to the current pullback. The Relative Strength Index (RSI) on the daily chart is at 42, indicating neutral momentum with bearish bias. The 50-day moving average at $91,500 has been breached, while the 200-day moving average at $88,500 provides critical support. Volume profile analysis shows high liquidity between $89,000 and $90,000, suggesting potential consolidation. A Bullish Invalidation level is set at $88,500; a break below targets the next support at $85,200 (Fibonacci 0.618 retracement). A Bearish Invalidation level is $93,500; a close above would negate the current downtrend structure.
| Metric | Value |
|---|---|
| Crypto Fear & Greed Index | 27/100 (Fear) |
| Bitcoin Current Price | $90,934 |
| 24-Hour Price Change | 0.04% |
| Market Rank | #1 |
| Total ETF Outflows (3 Days) | ~$1.1B |
| Largest Single-Day Outflow | $400M (Jan 8) |
Institutional impact is significant: sustained ETF outflows reduce direct buying pressure on spot markets, potentially leading to a liquidity grab by market makers. According to the Federal Reserve's monetary policy reports, tighter liquidity conditions can exacerbate such outflows. Retail impact is muted but notable; small inflows into BITB and BTCW suggest retail investors are using dips for accumulation, but overall sentiment remains fearful. This matters for the 5-year horizon as it tests Bitcoin's resilience as a macro asset; similar outflows in 2021 preceded a multi-year consolidation phase. Market structure suggests that if outflows continue, Bitcoin may enter a distribution phase, affecting altcoin correlations and overall market beta.
Market analysts on X/Twitter highlight the technical breakdown. One quant trader noted, "The $92k resistance held firm, creating a sell-side liquidity pool that ETFs are now tapping into." Bulls argue this is healthy profit-taking after the Q4 2025 rally, while bears point to weakening on-chain metrics like declining exchange reserves. Sentiment remains divided, but the fear index at 27 reflects growing caution. No specific person is quoted in the source, but overall discourse centers on whether this is a temporary correction or start of a deeper downtrend.
Bullish Case: If Bitcoin holds the $88,500 support and ETF outflows subside, a rebound to $95,000 is likely. Market structure suggests the current FVG between $90,000 and $92,000 could be filled quickly, driven by retail accumulation and institutional re-entry. Historical patterns indicate that three-day outflow streaks often reverse within a week, especially when fear metrics are extreme.
Bearish Case: If outflows persist and $88,500 breaks, Bitcoin could target $85,200 (Fibonacci support) or lower. On-chain data indicates increasing sell pressure from long-term holders, potentially leading to a cascade if macroeconomic conditions worsen. A break below $85,200 would invalidate the bullish market structure established in late 2025.
Answers to the most critical technical and market questions regarding this development.

Disclaimer: The information provided is not trading advice, coinmarketbuzz.com holds no liability for any investments made based on the information provided on this page. We strongly recommend independent research and/or consultation with a qualified professional before making any investment decisions.
coinmarketbuzz.com leverages advanced AI technology to analyze market data. All content is fact-checked and reviewed by our editorial team to ensure accuracy and neutrality.