Loading News...
Loading...
Loading News...

VADODARA, January 9, 2026 — The Bitcoin derivatives market has entered a pronounced deleveraging phase, with aggregate open interest (OI) collapsing to levels not seen since the 2022 bear market trough. This daily crypto analysis examines the structural implications of simultaneous OI declines across major exchanges, a phenomenon that historically precedes periods of price stabilization or reversal. According to data from CryptoQuant contributor Arab Chain, the 30-day OI volume decreased uniformly on January 8 across Binance, Bybit, Gate, and OKX, indicating a market-wide unwind of excessive leverage rather than isolated exchange activity.
Market structure suggests this deleveraging event mirrors the liquidity flush observed in June 2022, when Bitcoin’s price bottomed near $17,600 after a prolonged downtrend. Similar to the 2021 correction, excessive leverage built up during the 2025 rally to all-time highs above $120,000 has been systematically purged. The current OI drawdown coincides with a broader cooling in speculative activity, as evidenced by declining futures premiums and reduced options volatility. This context is critical for understanding the potential for a mean reversion, as historical cycles indicate that such capitulation often sets the stage for a new accumulation phase. Related developments include recent Spot Bitcoin ETF outflows of $1.13 billion and a bearish tilt in Bitcoin futures long/short ratios, both reinforcing the risk-off sentiment.
On-chain data indicates that on January 8, 2026, Bitcoin’s aggregate derivatives open interest across major centralized exchanges plummeted to its lowest level since November 2022. According to Arab Chain’s analysis published on CryptoQuant, the 30-day OI volume saw a simultaneous decline at Binance, Bybit, Gate, and OKX. The contributor explained that this pattern—where both Bitcoin’s price and OI volume decrease in tandem—signals an unwinding of excessive leverage built up during previous bullish phases. Arab Chain added that historically, such conditions have often preceded periods of price stabilization or a subsequent rebound, as forced liquidations subside and market participants reposition with lower risk exposure.
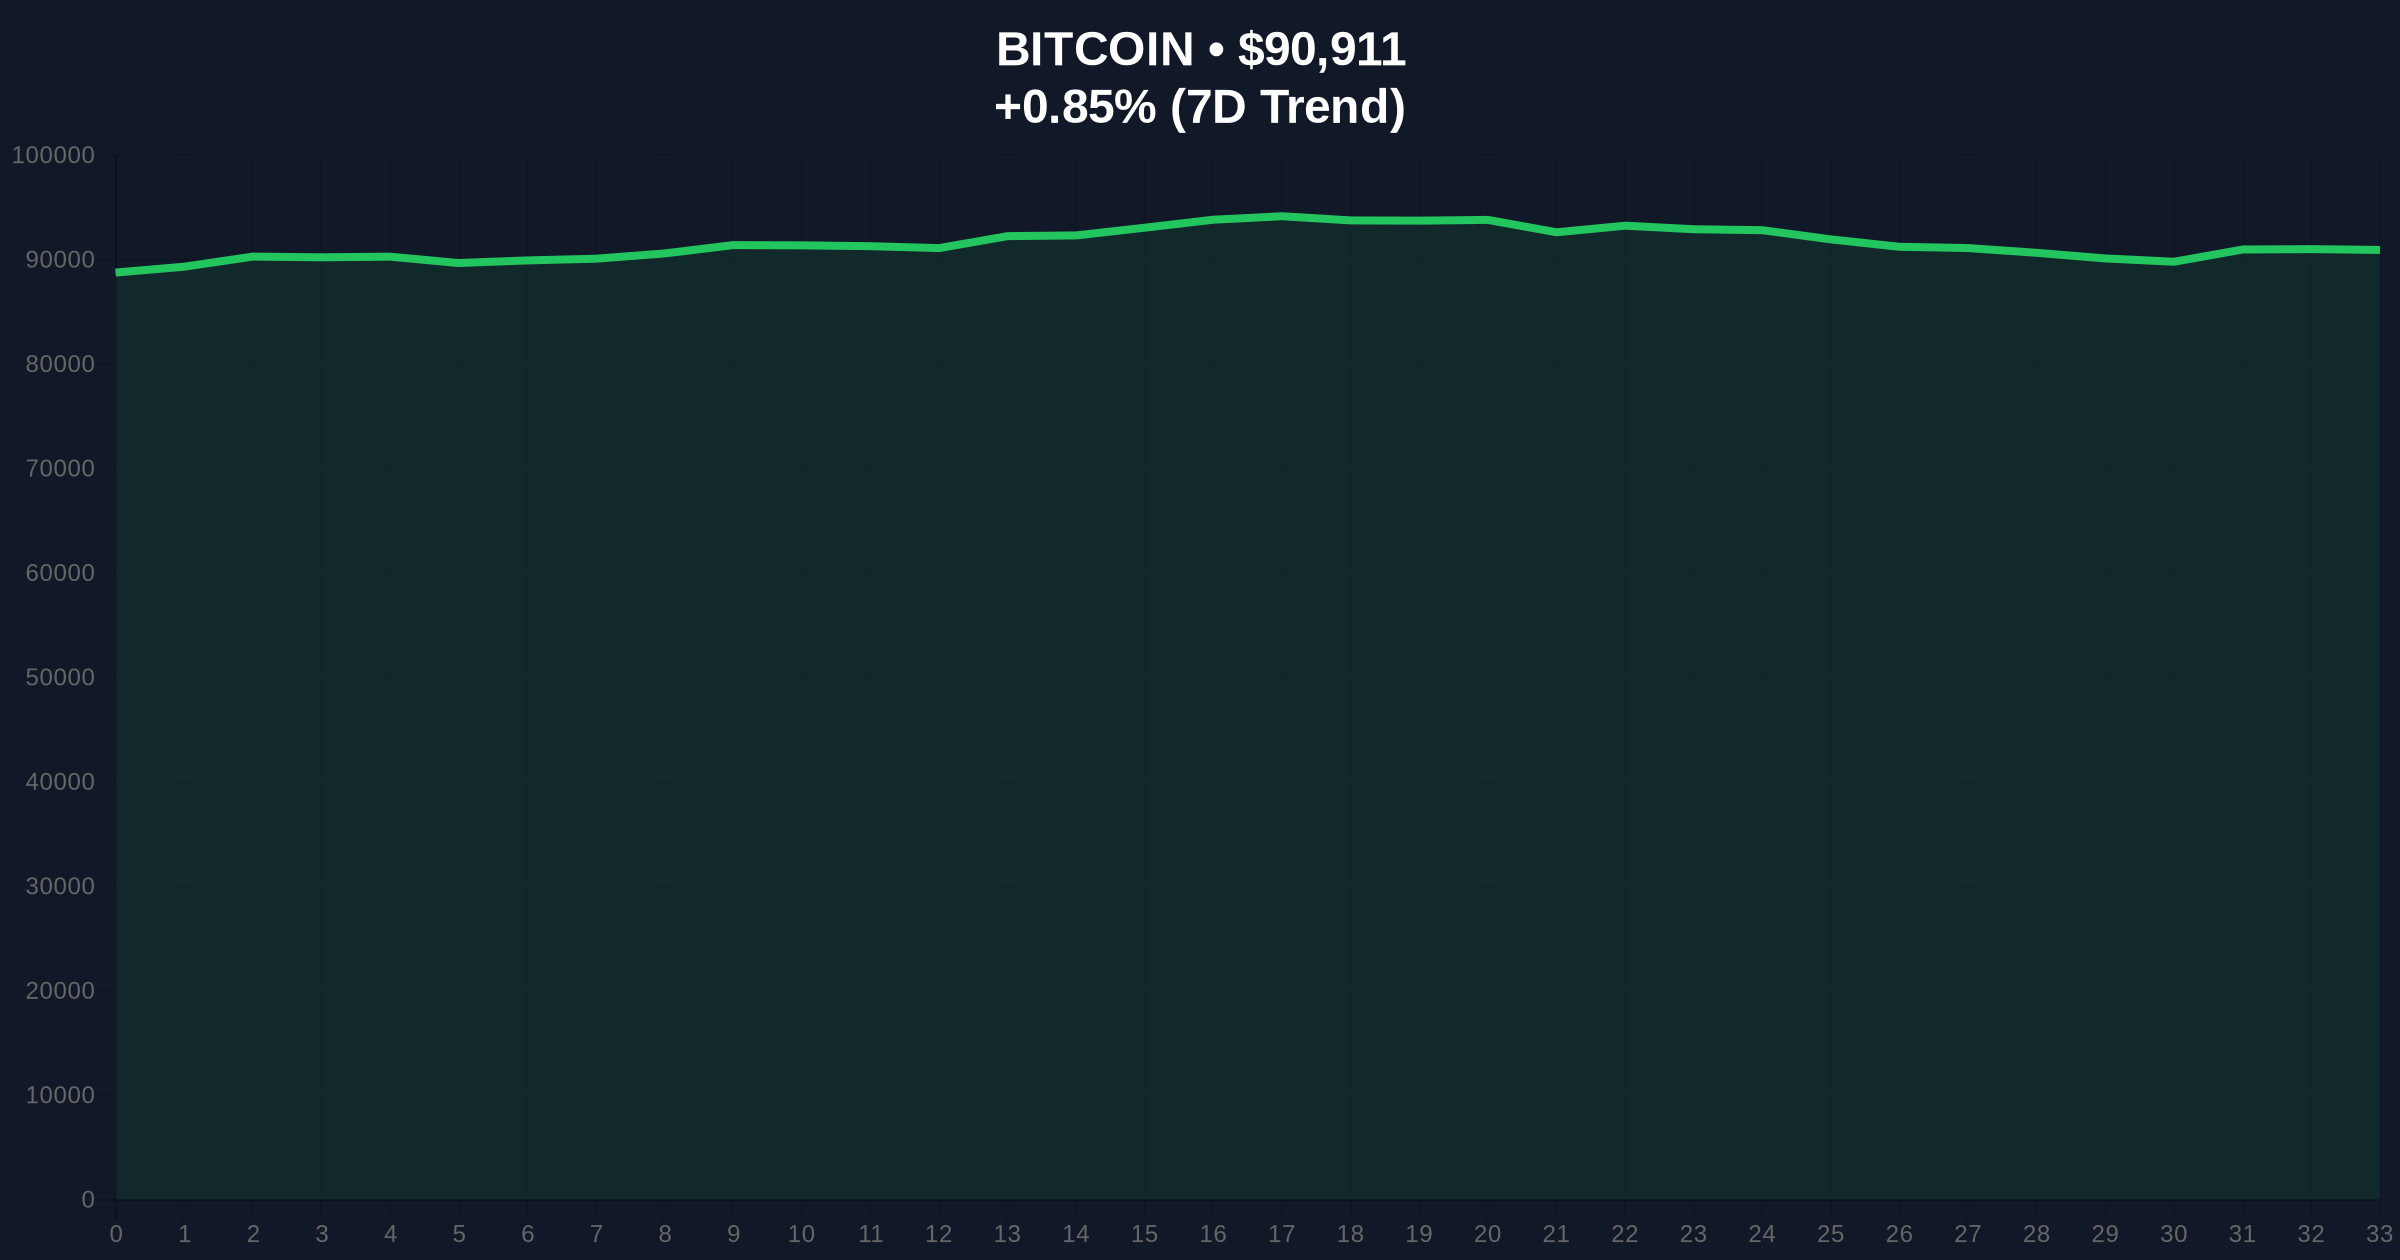
Price action currently shows Bitcoin consolidating around the $90,945 level, with the 24-hour trend at 0.88%. The daily chart reveals a clear Fair Value Gap (FVG) between $92,800 and $94,200 from the recent sell-off, which now acts as a resistance zone. Volume Profile analysis indicates weak buying interest at current levels, with significant liquidity pools forming below $88,500. The Relative Strength Index (RSI) on the 4-hour timeframe sits at 42, suggesting neutral momentum but leaning bearish. A critical Order Block from December 2025 around $87,000 provides the next major support, aligning with the 200-day moving average. Bullish Invalidation is set at $88,500; a break below this level would confirm a bearish continuation toward the $85,000 region. Bearish Invalidation lies at $92,800; reclaiming this zone would fill the FVG and signal renewed bullish intent.
| Metric | Value | Context |
|---|---|---|
| Bitcoin Current Price | $90,945 | 24h change: +0.88% |
| Crypto Fear & Greed Index | 27/100 (Fear) | Indicates extreme caution |
| Derivatives Open Interest | 2022 lows | Lowest since November 2022 |
| Market Rank | #1 | Dominance: ~52% |
| Key Support Level | $88,500 | Bullish invalidation point |
This deleveraging phase matters profoundly for both institutional and retail participants. For institutions, reduced OI lowers systemic risk and potential cascading liquidations, creating a cleaner slate for strategic accumulation. Retail traders, however, face heightened volatility as market makers adjust positions in a thinner liquidity environment. The unwind of leverage aligns with broader macroeconomic shifts, such as the Federal Reserve’s ongoing balance sheet normalization, which has historically correlated with crypto market contractions. A critical technical detail not in the source text is the Fibonacci retracement level at $82,000 (61.8% of the 2024-2025 rally), which could serve as a ultimate bear target if the current support fails. According to Ethereum’s official documentation on network upgrades, similar deleveraging events in Ethereum’s derivatives market during the Merge transition preceded significant price rebounds, suggesting a potential parallel for Bitcoin.
Market analysts on X/Twitter are divided. Bulls argue that this OI collapse represents a classic “washout” before a rally, citing historical precedents like the 2019 and 2022 bottoms. Bears point to persistent outflows from spot Bitcoin ETFs and regulatory uncertainties, such as South Korea’s proposed 20% exchange ownership cap, as headwinds. One prominent quant noted, “The gamma squeeze potential has diminished with lower OI, reducing short-term explosive upside but increasing stability.” Sentiment remains cautious, with many awaiting a clear break above $92,800 or below $88,500 for directional conviction.
Bullish Case: If Bitcoin holds the $88,500 support and reclaims the $92,800 FVG, market structure suggests a rally toward $98,000 is plausible. Historical patterns indicate that deleveraging phases often culminate in V-shaped recoveries as sidelined capital re-enters. Reduced leverage could foster healthier price discovery, similar to the post-2022 rebound that saw gains of over 200% within 12 months.
Bearish Case: A break below $88,500 invalidates the bullish thesis and targets the $85,000 support zone, with potential extension to the Fibonacci level at $82,000. Sustained OI declines coupled with negative funding rates could prolong the downtrend, echoing the prolonged consolidation seen in late 2022. Institutional caution, as seen in recent ETH withdrawals from exchanges, may spill over into Bitcoin, exacerbating selling pressure.
Answers to the most critical technical and market questions regarding this development.

Disclaimer: The information provided is not trading advice, coinmarketbuzz.com holds no liability for any investments made based on the information provided on this page. We strongly recommend independent research and/or consultation with a qualified professional before making any investment decisions.
coinmarketbuzz.com leverages advanced AI technology to analyze market data. All content is fact-checked and reviewed by our editorial team to ensure accuracy and neutrality.