Loading News...
Loading...
Loading News...

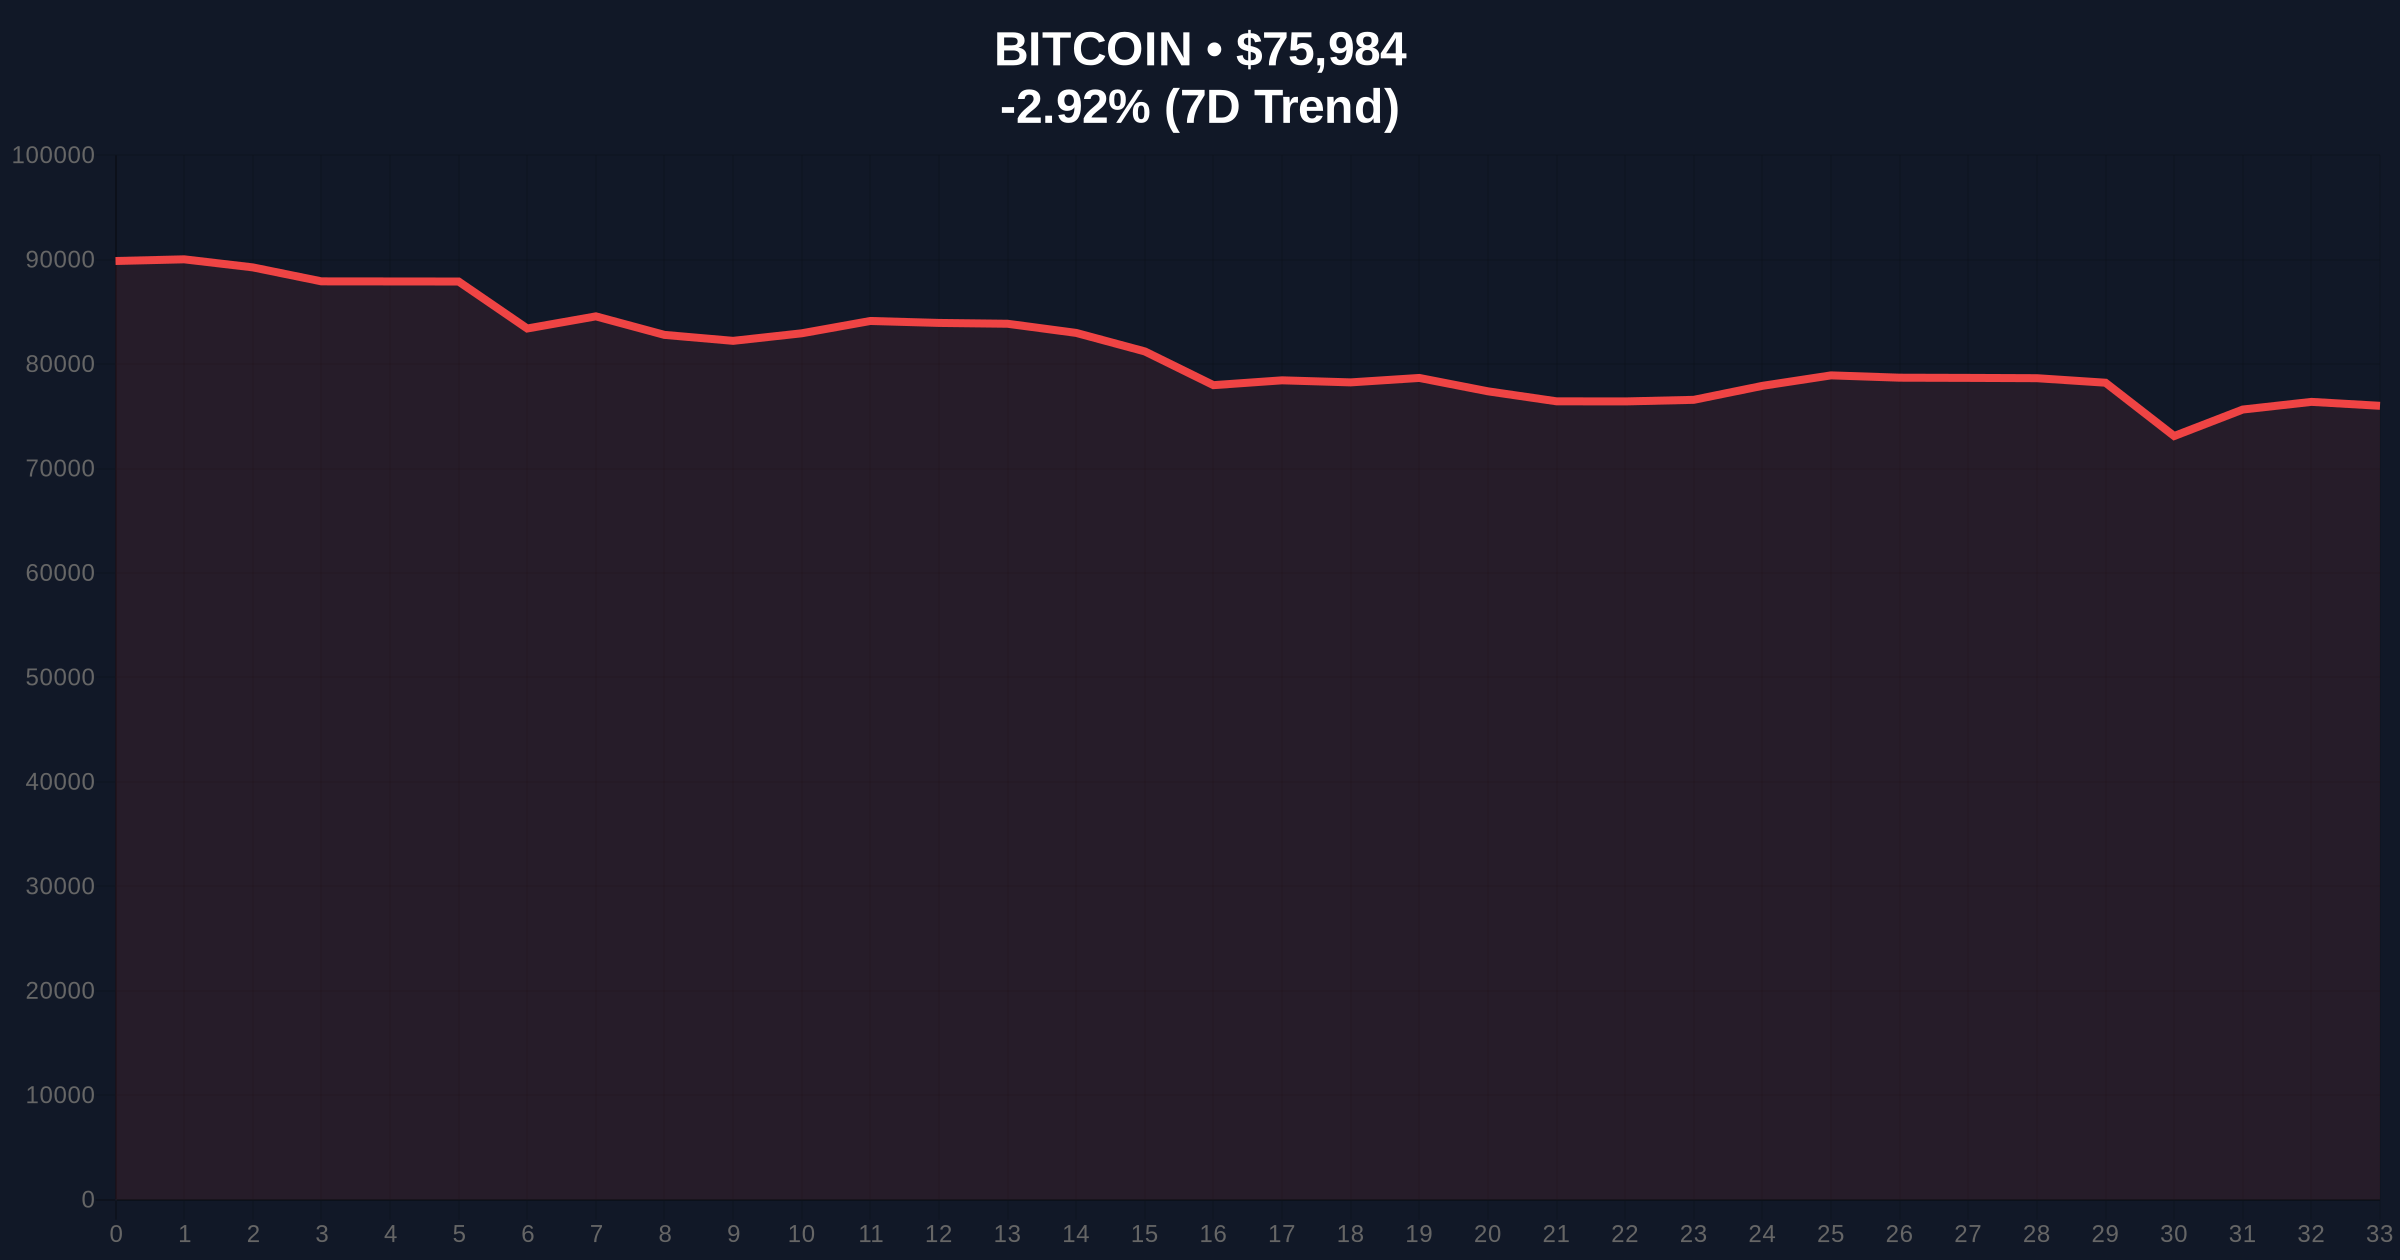
VADODARA, February 4, 2026 — Bitcoin faces mounting pressure to retest the $70,000 support level as spot ETF inflows decelerate and regulatory uncertainty persists, according to a new institutional report from Citigroup. This latest crypto news highlights a critical juncture for Bitcoin's price action, with the cryptocurrency trading at $76,040, significantly below the average ETF investor entry point of $81,600.
Citigroup's research team identified three primary pressure vectors on Bitcoin's valuation. According to their report, spot Bitcoin ETF inflows have slowed substantially from their January peak. This reduction in institutional capital coincides with persistent futures market liquidations. The report specifically notes Bitcoin's failure to rally alongside gold despite similar geopolitical risk exposure.
Market structure suggests Bitcoin remains more sensitive to liquidity conditions than traditional safe-haven assets. Citi analysts highlighted the delayed U.S. crypto market structure bill (CLARITY) as a regulatory overhang. , concerns about reduced liquidity from the Federal Reserve's ongoing balance sheet reduction program add macro pressure. The Federal Reserve's quantitative tightening timeline directly impacts risk asset valuations.
Historically, Bitcoin has experienced similar periods of ETF inflow deceleration. The 2021 cycle saw multiple corrections of 20-30% following institutional capital rotation. In contrast, the current environment features more pronounced regulatory uncertainty. Underlying this trend is the convergence of profit-loss supply metrics, which some analysts believe could signal a market bottom formation.
Similar to the 2021 correction, long futures positions continue to face liquidation pressure. This creates a negative feedback loop that exacerbates downside momentum. The current price action mirrors patterns observed during previous macro liquidity contractions. Consequently, the market faces a critical test at the psychologically significant $70,000 level.
Related Developments: Recent analysis indicates a potential market bottom forming around $60k based on supply convergence, while technical patterns suggest a head and shoulders formation could drive prices lower.
On-chain data indicates Bitcoin currently trades below the critical Fibonacci 0.618 retracement level from its all-time high. The $70,000 support represents the 0.786 Fibonacci level, a common accumulation zone in previous cycles. Market structure suggests a clear Fair Value Gap (FVG) exists between $76,000 and $81,600.
This FVG creates a natural resistance zone that must be reclaimed for bullish momentum to resume. Volume Profile analysis shows weak buying interest above the current price. The Relative Strength Index (RSI) sits in neutral territory at 42, indicating neither overbought nor oversold conditions. However, the 50-day moving average has crossed below the 200-day MA, forming a death cross pattern.
| Metric | Value | Significance |
|---|---|---|
| Crypto Fear & Greed Index | 14/100 (Extreme Fear) | Indicates maximum capitulation potential |
| Bitcoin Current Price | $76,040 | 13.6% below average ETF entry |
| 24-Hour Price Change | -2.85% | Continuing downward momentum |
| Critical Support Level | $70,000 | Pre-election price point |
| Average ETF Entry Price | $81,600 | Creates overhead supply zone |
This analysis matters because it reveals fundamental shifts in institutional market structure. Slowing ETF inflows suggest early adopters may be taking profits. Regulatory uncertainty creates a holding pattern for new capital. The Federal Reserve's balance sheet reduction directly impacts global liquidity conditions.
Market structure suggests we are witnessing a classic liquidity grab. Weak hands exit positions during periods of extreme fear. Consequently, strong institutional buyers accumulate at discounted levels. This pattern mirrors the 2018-2019 accumulation phase that preceded the 2021 bull market.
"The convergence of slowing ETF inflows, regulatory delays, and macro liquidity contraction creates a perfect storm for Bitcoin. Market structure suggests the $70,000 level represents a critical Order Block from the pre-election period. A clean break below this level would invalidate the current bullish market structure and potentially trigger a deeper correction toward the $60,000 convergence zone."— CoinMarketBuzz Intelligence Desk
Market structure suggests two primary scenarios based on the $70,000 level. Historical cycles indicate this price point represents a major psychological and technical barrier.
The 12-month institutional outlook depends heavily on regulatory clarity and ETF flow stabilization. If the CLARITY Act passes and ETF inflows resume, Bitcoin could reclaim its upward trajectory. However, continued regulatory uncertainty and Fed tightening could extend the current correction phase into Q3 2026.

Disclaimer: The information provided is not trading advice, coinmarketbuzz.com holds no liability for any investments made based on the information provided on this page. We strongly recommend independent research and/or consultation with a qualified professional before making any investment decisions.
coinmarketbuzz.com leverages advanced AI technology to analyze market data. All content is fact-checked and reviewed by our editorial team to ensure accuracy and neutrality.