Loading News...
Loading...
Loading News...

VADODARA, February 4, 2026 — Bitcoin's on-chain supply in profit is converging with supply held at a loss, a pattern Glassnode data shows historically coincides with market bottoms. This daily crypto analysis examines whether current metrics signal a genuine accumulation zone or another liquidity trap.
According to Glassnode liquidity maps, 11.1 million BTC currently sit in profitable positions. Conversely, 8.9 million BTC are held at a loss. The gap between these two metrics is narrowing amid recent price declines. Market structure suggests this convergence mirrors patterns observed in November 2022, March 2020, January 2019, and 2015. Each instance preceded significant price reversals.
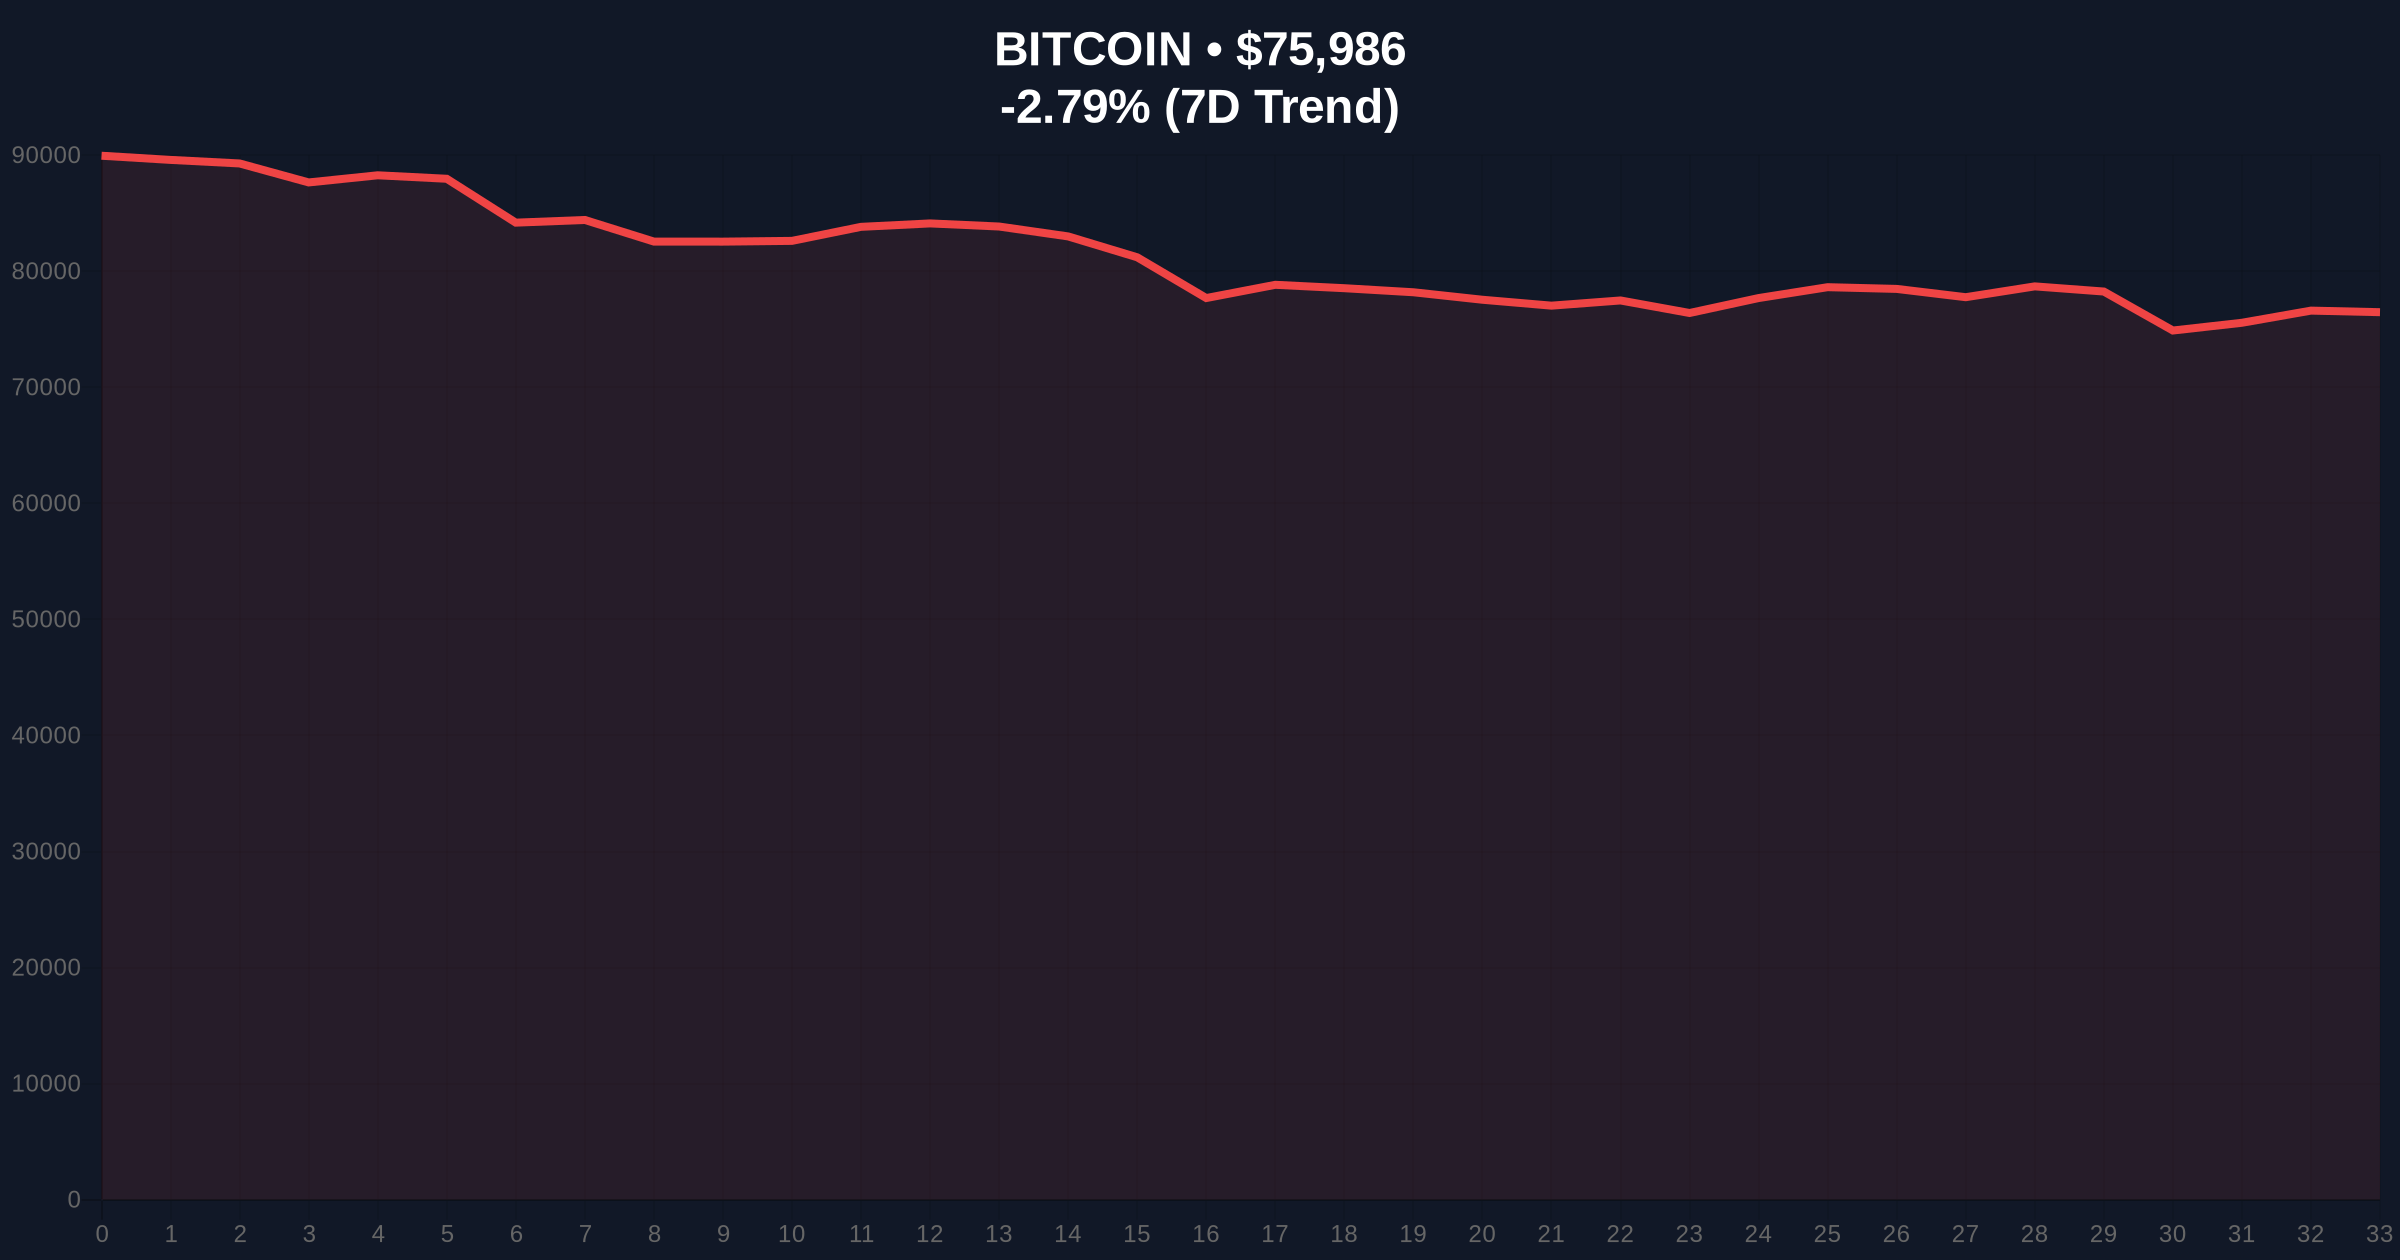
The outlet noted the price point where profitable and loss-making supplies would equalize is around $60,000. This creates a clear Fair Value Gap (FVG) between current trading near $75,979 and the projected equilibrium. On-chain data indicates this level acts as a magnetic price target during supply rebalancing events.
Historically, profit-loss supply convergence occurs when long-term holders refuse to sell at a loss. This creates a volume profile vacuum that often precedes violent reversals. In contrast, the current market shows extreme fear sentiment scoring 14/100. This contradicts typical bottom formation psychology where fear peaks before capitulation.
Underlying this trend is a critical question: does this convergence reflect genuine accumulation or simply reduced selling pressure from exhausted bulls? The 2022 convergence preceded a 160% rally, but the 2015 pattern saw 18 months of sideways consolidation before the next bull cycle. Market analysts debate whether current macro conditions mirror either scenario.
Related Developments: This supply dynamic occurs alongside other market shifts, including gold volatility surpassing Bitcoin's for the first time since 2008 and ongoing debates about Ethereum's layer-2 redefinition.
Current price action shows Bitcoin trading 2.79% lower at $75,979. The critical Fibonacci 0.618 retracement level from the 2025 all-time high sits at $72,400, creating a potential support confluence with the supply equilibrium zone. The 200-week moving average at $68,200 provides additional structural support.
RSI readings hover near oversold territory at 32, but have not reached the extreme lows below 25 seen during previous capitulation events. Order block analysis reveals significant liquidity pools between $70,000 and $65,000 that could trigger accelerated moves toward the $60,000 equilibrium. UTXO age bands show older coins (6+ months) remain largely dormant, suggesting hodler conviction despite price declines.
| Metric | Value | Significance |
|---|---|---|
| Crypto Fear & Greed Index | 14/100 (Extreme Fear) | Contrarian signal often preceding reversals |
| Bitcoin Current Price | $75,979 | -2.79% 24h change |
| BTC in Profit | 11.1M | 55.5% of circulating supply |
| BTC at Loss | 8.9M | 44.5% of circulating supply |
| Projected Equilibrium | $60,000 | Where profit/loss supplies equalize |
This convergence matters because it reflects the aggregate cost basis of Bitcoin holders. When these metrics approach parity, it indicates the market has absorbed most overleveraged positions. Institutional liquidity cycles typically begin at such inflection points, as evidenced by projected accumulation windows in mid-2026.
Real-world evidence comes from exchange net flows, which show modest inflows during this convergence period. This suggests some capitulation but not the massive exodus seen at previous cycle bottoms. Retail market structure appears fragile, with derivatives data indicating elevated funding rates despite price declines—a potential contradiction.
"The supply convergence pattern is mathematically significant, but current macro conditions differ substantially from 2022 or 2020. The Federal Reserve's ongoing quantitative tightening, as documented on FederalReserve.gov, creates headwinds not present during previous convergence events. This could extend the bottoming process or create a false signal." — CoinMarketBuzz Intelligence Desk
Two data-backed technical scenarios emerge from current market structure. The bullish case requires holding above the Fibonacci 0.786 level at $69,500 to maintain higher timeframe structure. The bearish scenario involves a breakdown toward the projected $60,000 equilibrium, potentially triggering a gamma squeeze in options markets.
The 12-month institutional outlook remains cautiously optimistic if the $60,000 level holds as a structural bottom. Historical cycles suggest 6-18 month consolidation periods follow such convergence events before the next major advance. However, the 5-year horizon appears constructive if Bitcoin maintains its network security budget post-halving, a critical technical detail not addressed in most surface-level analyses.

Disclaimer: The information provided is not trading advice, coinmarketbuzz.com holds no liability for any investments made based on the information provided on this page. We strongly recommend independent research and/or consultation with a qualified professional before making any investment decisions.
coinmarketbuzz.com leverages advanced AI technology to analyze market data. All content is fact-checked and reviewed by our editorial team to ensure accuracy and neutrality.