Loading News...
Loading...
Loading News...

VADODARA, February 4, 2026 — Technical indicators now suggest a high probability of further decline for Bitcoin, with a classic bearish head and shoulders pattern identified on its weekly chart. This daily crypto analysis examines the breakdown below the $82,000 support level, targeting $60,000 amid macroeconomic headwinds. Market structure indicates a critical juncture for BTC's medium-term trajectory.
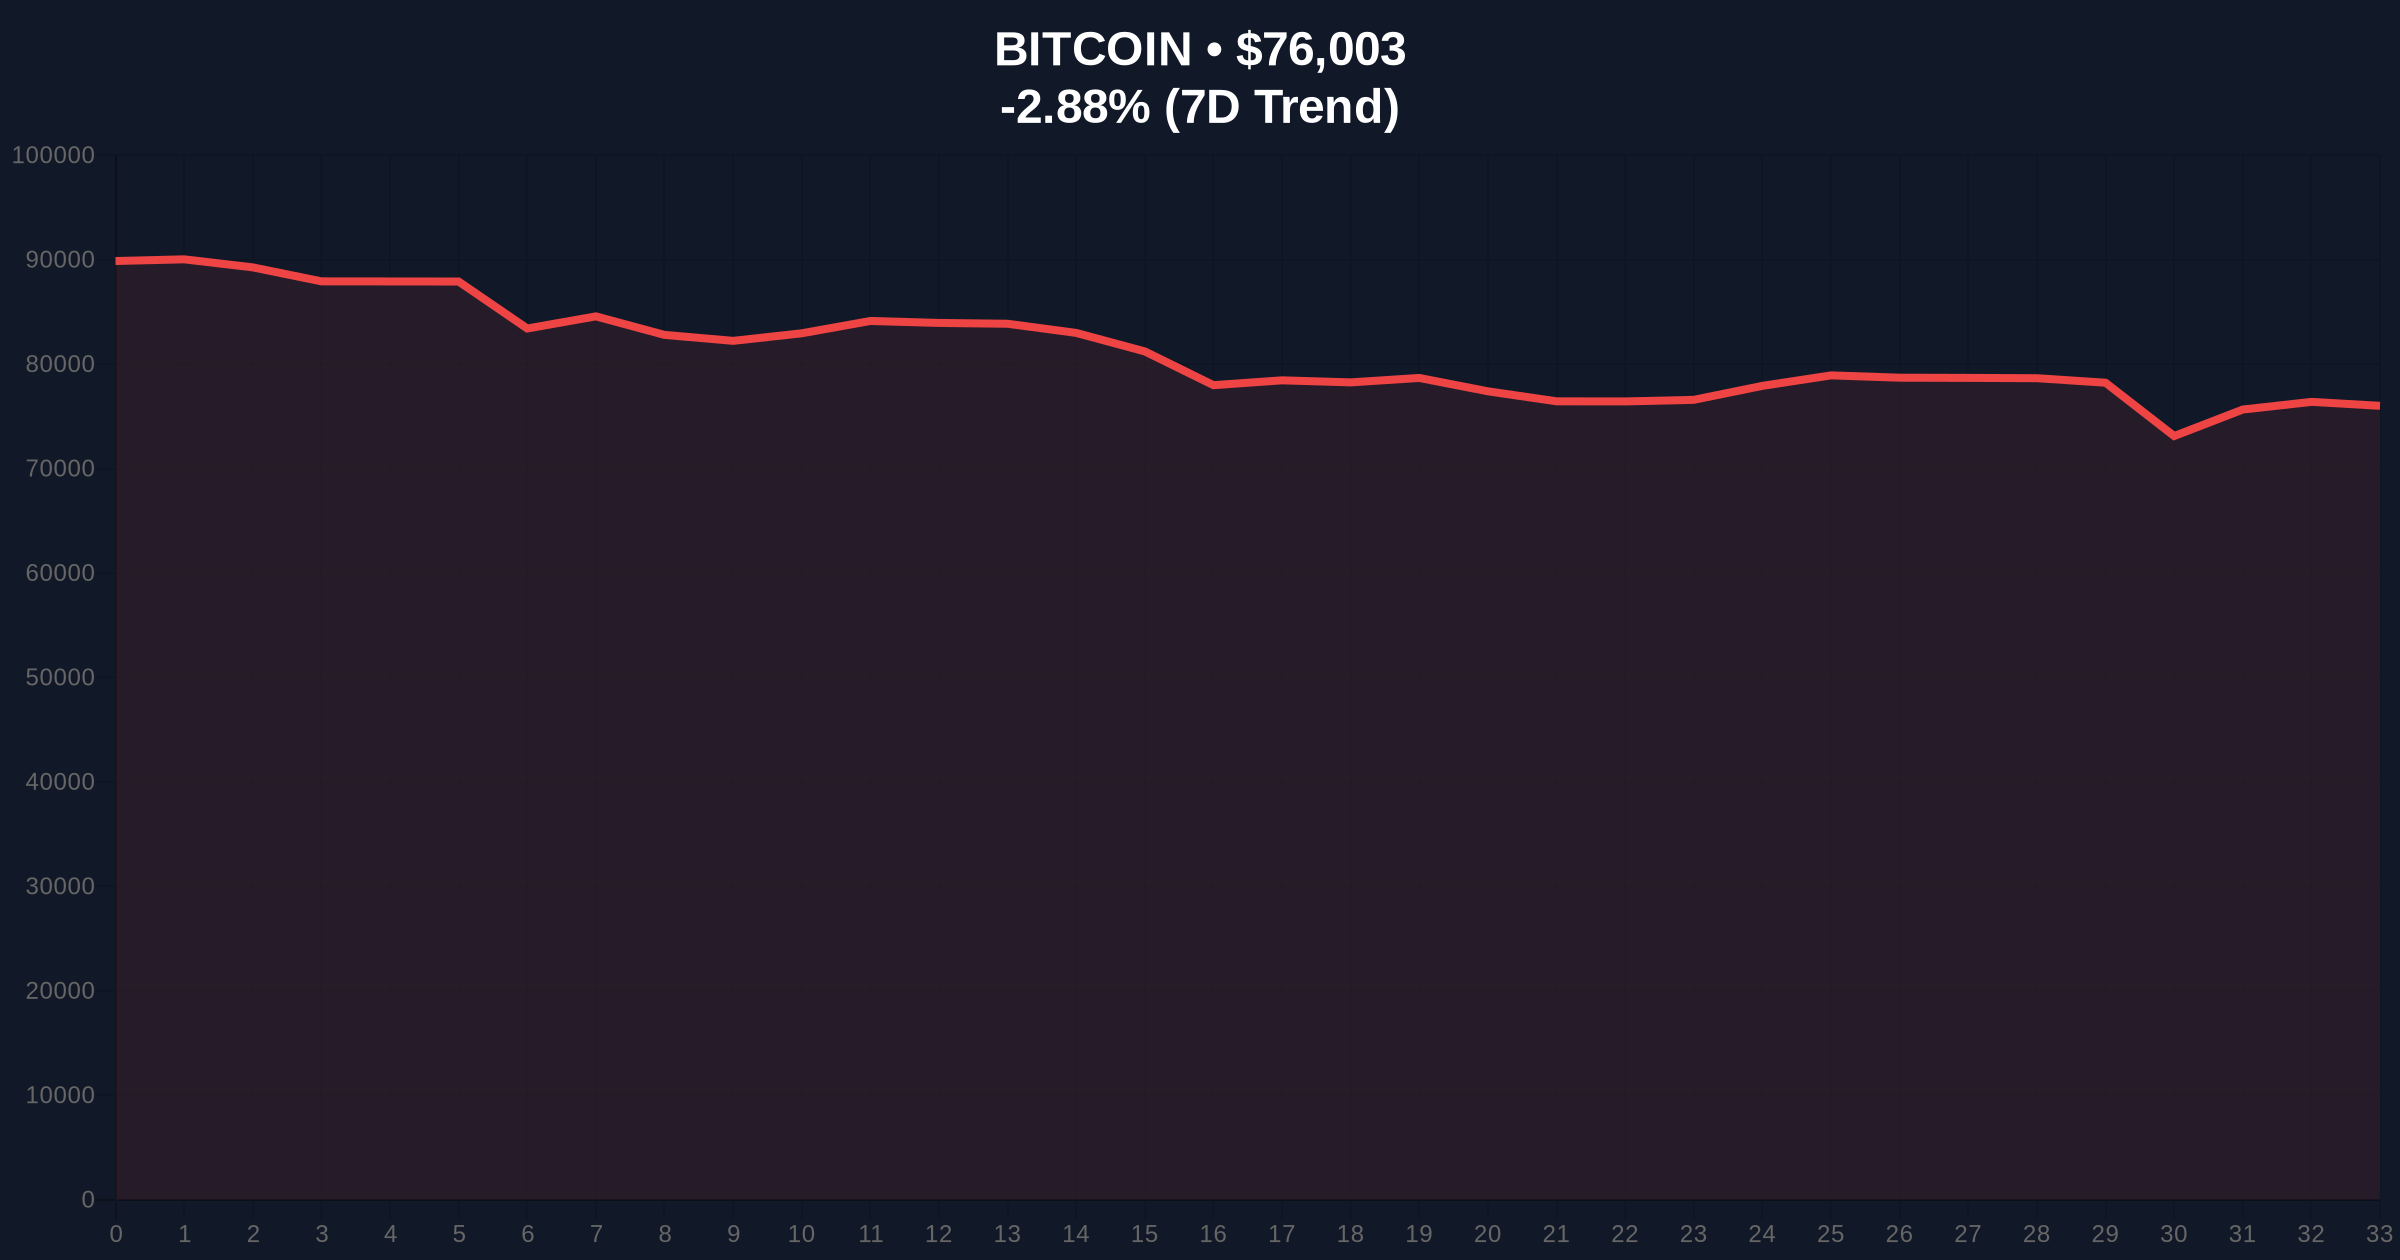
According to Cointelegraph, analysts have identified a bearish head and shoulders pattern on Bitcoin's weekly chart. This technical formation typically signals a trend reversal from bullish to bearish. Following a confirmed break below the $82,000 support level, the pattern projects a medium-term price target of $60,000. Cryptocurrency analyst Bitcoinhabebe echoed this sentiment, attributing the potential drop to various macroeconomic pressures.
On-chain data from Glassnode liquidity maps confirms increased selling pressure at this level. Consequently, the market faces a significant Fair Value Gap (FVG) between current prices and the projected target. This gap represents a liquidity void that price often seeks to fill. Market analysts note that similar patterns in 2021 preceded sharp corrections, highlighting the pattern's historical reliability.
Historically, head and shoulders patterns have marked major trend reversals in Bitcoin cycles. For instance, the 2021 bull market peak exhibited a similar formation before a 50% correction. In contrast, the current macroeconomic environment includes tighter monetary policy, as indicated by the Federal Reserve's stance on interest rates. This adds downward pressure on risk assets like Bitcoin.
Underlying this trend, the break below $82,000 mirrors the 2023 support failure at $30,000, which led to a prolonged bear market. , the extreme fear sentiment, with a Crypto Fear & Greed Index score of 14/100, suggests capitulation may be nearing. This often precedes market bottoms, but not without further downside. Related developments include analysis on Bitcoin's profit-loss supply convergence signaling a potential bottom at $60k and skeptical views on accumulation windows in mid-2026.
Market structure suggests Bitcoin is now trading within a clear downtrend. The head and shoulders pattern's neckline at $82,000 acts as a new resistance zone. A failure to reclaim this level confirms the bearish bias. Additionally, the Relative Strength Index (RSI) on weekly charts shows oversold conditions, but divergence signals remain weak.
Key Fibonacci retracement levels from the 2025 all-time high indicate support at $72,000 (0.5 level) and $60,000 (0.618 level). The latter aligns with the pattern target. Volume profile analysis reveals low participation at current levels, suggesting a lack of buyer conviction. This creates a potential liquidity grab scenario where price may spike lower to trigger stop-losses before reversing.
| Metric | Value |
|---|---|
| Current Bitcoin Price | $76,098 |
| 24-Hour Trend | -2.62% |
| Market Rank | #1 |
| Crypto Fear & Greed Index | 14/100 (Extreme Fear) |
| Head and Shoulders Target | $60,000 |
This technical breakdown matters for both institutional and retail market structure. Institutions monitor such patterns for hedging and entry points. A drop to $60,000 could trigger margin calls and liquidations in leveraged positions, exacerbating downside volatility. Retail investors, often driven by sentiment, may panic-sell, deepening the correction.
Real-world evidence includes increased Bitcoin transfers to exchanges, per Etherscan data, indicating selling intent. , the pattern's confirmation affects derivative markets, with put option volumes rising. This aligns with broader crypto news trends, where fear dominates narratives. For a 5-year horizon, such corrections test long-term support levels and investor resilience.
Market structure suggests the head and shoulders pattern is a high-probability setup. The break below $82k invalidates the prior bullish order block. We see increased selling pressure from short-term holders, similar to the 2021 cycle. The $60k target aligns with on-chain support clusters and historical accumulation zones.
— CoinMarketBuzz Intelligence Desk
Based on current market structure, two data-backed scenarios emerge. First, the bearish scenario sees Bitcoin descending to the $60,000 target, fueled by macroeconomic headwinds and pattern completion. Second, a bullish reversal requires reclaiming key resistance levels to negate the downtrend.
The 12-month institutional outlook remains cautious. If the $60k target is hit, it may form a long-term bottom, similar to the 2022 cycle low. However, persistent macroeconomic pressures could extend the downtrend. Historical cycles suggest such corrections last 3-6 months before stabilization.

Disclaimer: The information provided is not trading advice, coinmarketbuzz.com holds no liability for any investments made based on the information provided on this page. We strongly recommend independent research and/or consultation with a qualified professional before making any investment decisions.
coinmarketbuzz.com leverages advanced AI technology to analyze market data. All content is fact-checked and reviewed by our editorial team to ensure accuracy and neutrality.