Loading News...
Loading...
Loading News...


Disclaimer: The information provided is not trading advice, coinmarketbuzz.com holds no liability for any investments made based on the information provided on this page. We strongly recommend independent research and/or consultation with a qualified professional before making any investment decisions.
coinmarketbuzz.com leverages advanced AI technology to analyze market data. All content is fact-checked and reviewed by our editorial team to ensure accuracy and neutrality.
VADODARA, February 9, 2026 — CryptoQuant CEO Ki Young Ju has declared Bitcoin currently "unpumpable," stating that even massive capital inflows cannot spark a sustainable rally due to overwhelming selling pressure. This daily crypto analysis examines the on-chain data contradicting traditional market models.
Ki Young Ju posted on X that Bitcoin's market structure has fundamentally shifted. According to CryptoQuant data, a $10 billion capital inflow in 2024 increased Bitcoin's book value by $26 billion. In contrast, 2025 saw a $308 billion inflow, yet market capitalization decreased by $98 billion. Ju stated the simple formula of "inflows equal price gains" no longer holds true. He added corporate buying or Digital Asset Treasury plans remain ineffective until the market shifts.
Market structure suggests this represents a liquidity grab where sell-side volume absorbs all incoming capital. Consequently, the market lacks the bid depth necessary for sustained upward momentum. This creates a Fair Value Gap (FVG) between perceived value and price action.
Historically, Bitcoin bull markets required increasing capital efficiency. The 2017 cycle saw exponential returns per dollar invested. The 2021 cycle already showed diminishing returns. The current environment represents an extreme deviation. Underlying this trend is a massive distribution phase where long-term holders are liquidating positions.
In contrast, previous corrections like March 2020 saw rapid V-shaped recoveries because selling pressure quickly exhausted. Current on-chain data indicates persistent distribution across multiple UTXO age bands. This suggests a more structural bearish shift rather than a temporary correction.
Related developments include similar distribution patterns observed in other assets. For instance, XRP is experiencing a stop-loss phase mirroring the 2022 bear market, according to Glassnode analysis. , institutional players are positioning for volatility, as seen in Jump Trading's recent acquisitions for liquidity provision in prediction markets.
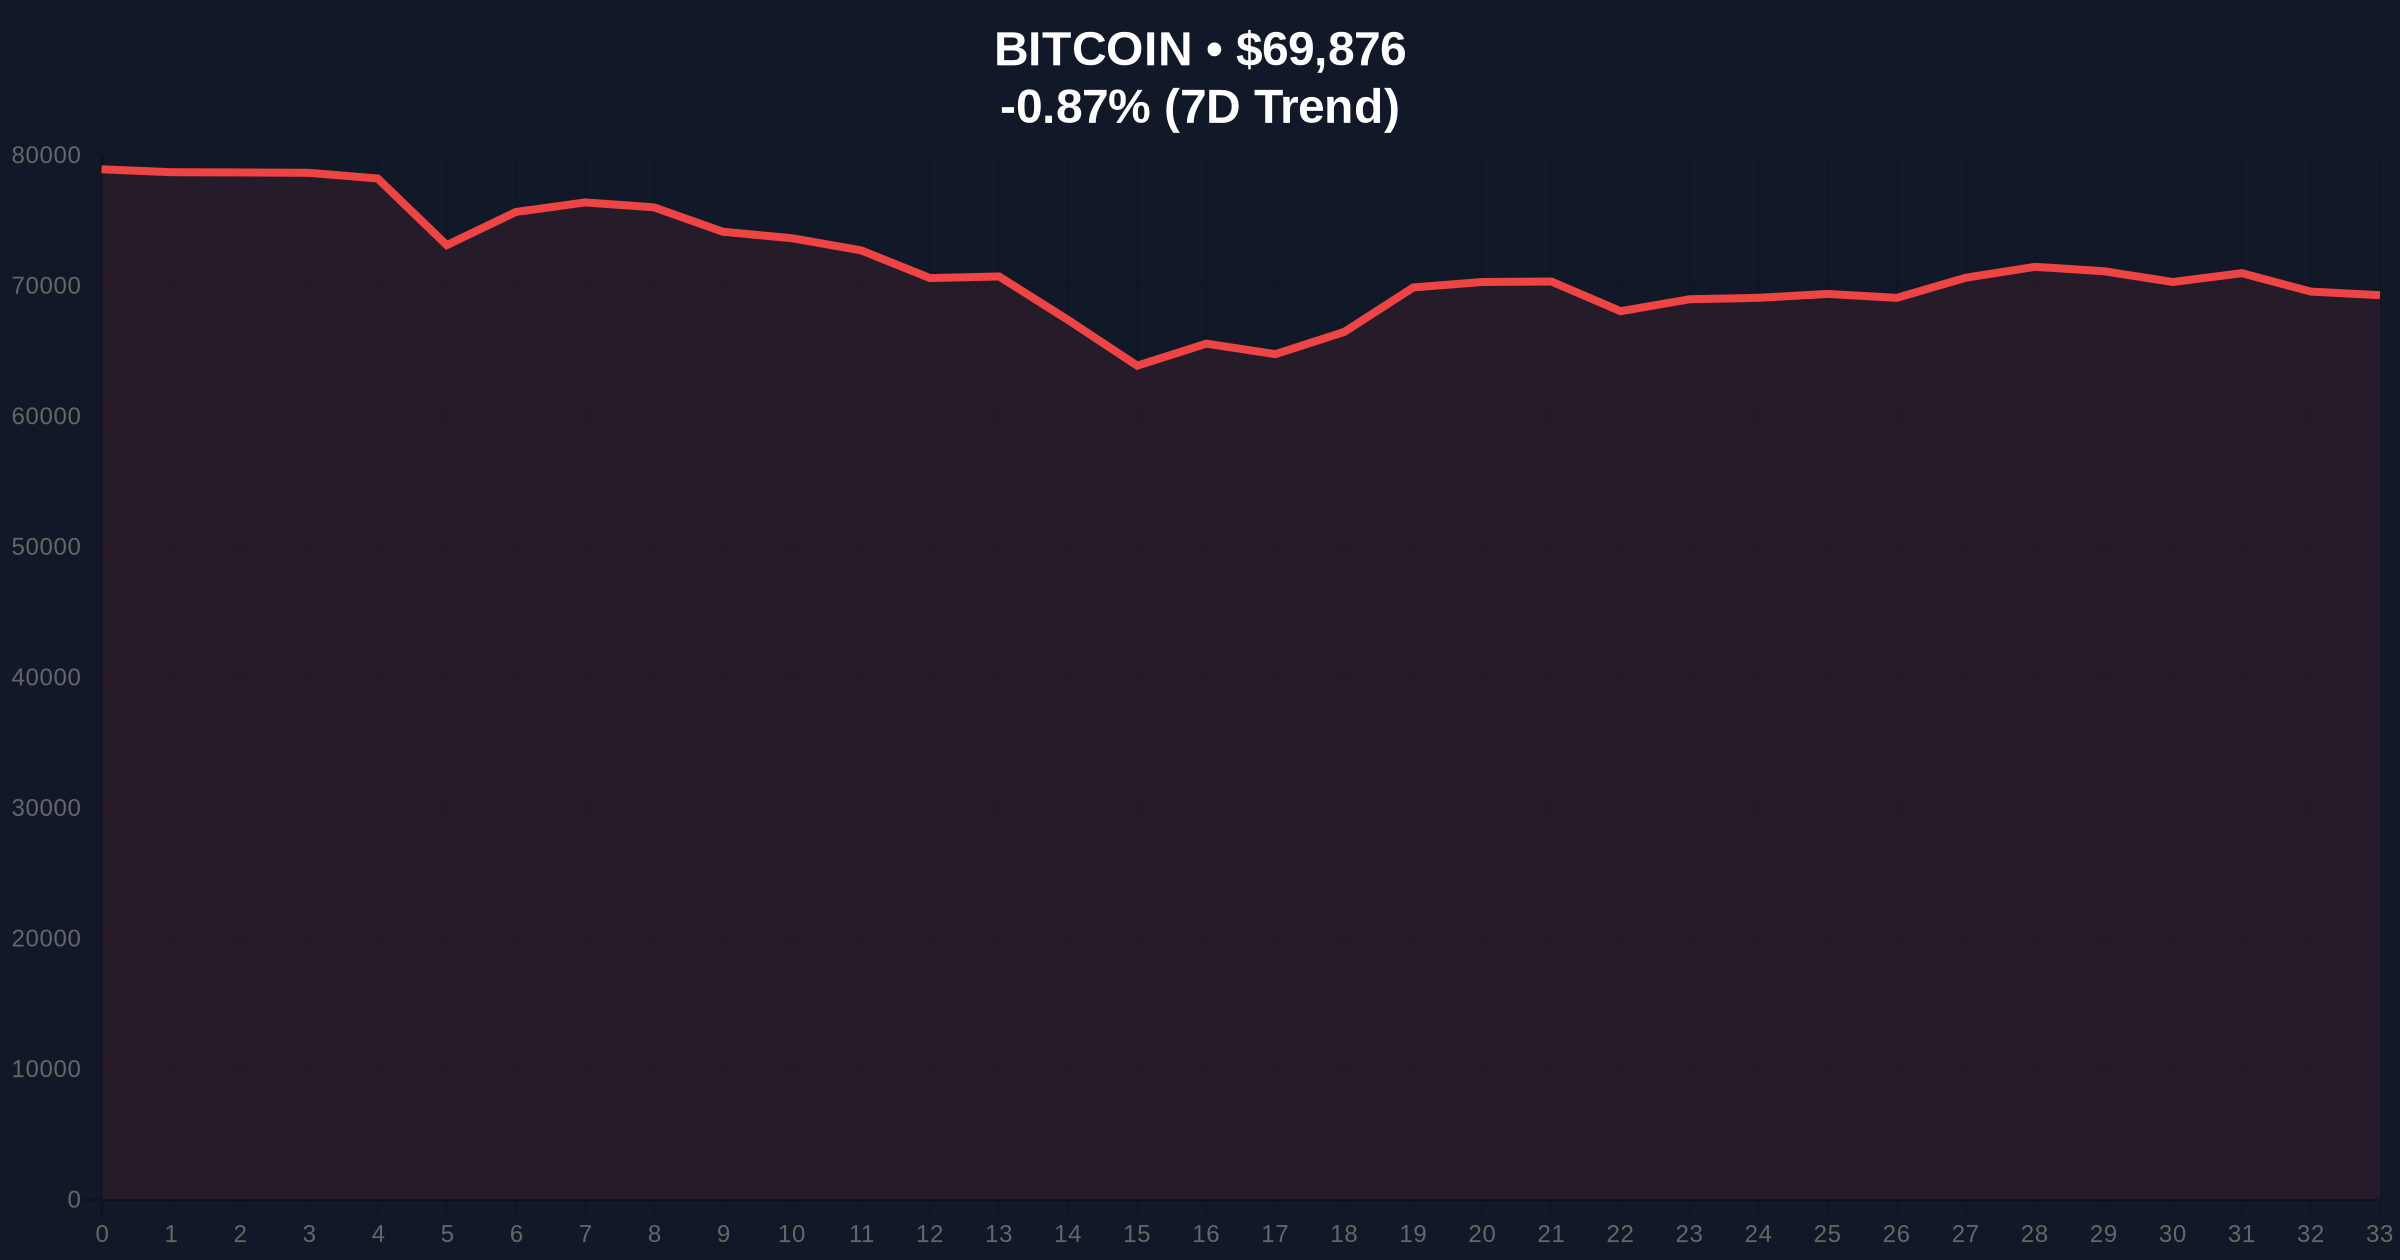
Bitcoin currently trades at $69,962, down 0.75% in 24 hours. The critical technical level is the Fibonacci 0.618 retracement at $68,500, which aligns with the 200-day moving average. A breakdown below this level would invalidate the current range-bound structure.
Volume Profile analysis shows significant selling clusters between $71,000 and $73,000. This creates a strong Order Block resistance zone. The Relative Strength Index (RSI) sits at 42, indicating neutral momentum with bearish bias. Market structure suggests we are in a distribution phase where rallies get sold into aggressively.
The Gamma Squeeze potential remains low due to options market positioning. Per data from Deribit, put/call ratios favor downside protection. This institutional hedging activity confirms the cautious sentiment described by Ju.
| Metric | Value | Implication |
|---|---|---|
| Crypto Fear & Greed Index | 14/100 (Extreme Fear) | Historically a contrarian signal, but current structure differs |
| Bitcoin Current Price | $69,962 | Testing key Fibonacci support at $68,500 |
| 24-Hour Price Change | -0.75% | Consolidation within distribution range |
| 2025 Capital Inflow | $308 billion | Produced $98B market cap decrease |
| 2024 Capital Efficiency | $10B inflow → $26B value | 2.6x multiplier now broken |
This breakdown matters because it challenges core investment theses. Institutional models assuming linear price-to-flow relationships require recalibration. The Federal Reserve's monetary policy documentation on balance sheet normalization suggests reduced liquidity could exacerbate this structural shift.
Real-world evidence appears in ETF flow data. Despite periodic inflows, net positions remain flat or negative. This indicates immediate profit-taking rather than accumulation. Retail market structure shows similar patterns with exchange net position changes turning negative during rallies.
"The data presents a clear contradiction. Massive capital should drive prices higher, but we're seeing the opposite. This suggests we're in a different regime where traditional catalysts like corporate buying have diminished impact until underlying market structure repairs." — CoinMarketBuzz Intelligence Desk
Two data-backed technical scenarios emerge from current market structure.
The 12-month institutional outlook depends on whether this represents a cycle top or mid-cycle correction. Historical cycles suggest distribution phases lasting 6-12 months before new accumulation begins. The 5-year horizon remains intact if Bitcoin maintains its $68,500 support, but a breakdown would extend the consolidation period.