Loading News...
Loading...
Loading News...

VADODARA, February 3, 2026 — Gold's 30-day price volatility has surged to 44%, exceeding Bitcoin's 39% volatility over the same period according to Bloomberg data analyzed by Unfolded. This represents gold's highest volatility reading since the 2008 global financial crisis, marking a historic inversion in traditional safe-haven behavior that demands daily crypto analysis of underlying market mechanics.
According to Bloomberg data cited by Unfolded, gold's 30-day realized volatility reached 44% this week. This figure surpasses Bitcoin's comparable volatility metric of approximately 39%. The data originates from standardized volatility calculations measuring percentage price movements over rolling 30-day windows. Consequently, this represents the first sustained period since 2008 where gold has demonstrated higher short-term volatility than Bitcoin.
Market structure suggests this inversion reflects deeper systemic stress. Underlying this trend, traditional financial instruments are experiencing liquidity fragmentation not seen since the Great Financial Crisis. The Federal Reserve's monetary policy documentation indicates tightening cycles have historically preceded such volatility spikes in hard assets. This current divergence from historical patterns warrants forensic examination of cross-asset correlations.
Historically, gold has maintained lower volatility than Bitcoin during most market cycles. In contrast, Bitcoin's volatility typically exceeded gold's by 2-3x during both bull and bear markets since 2017. This inversion breaks from fifteen years of established market behavior. , gold's current 44% volatility reading places it in the 99th percentile of historical observations since 1971.
Market analysts attribute this shift to multiple converging factors. Central bank gold purchases have reached record levels according to World Gold Council data. Simultaneously, geopolitical tensions have created unprecedented demand for physical bullion. These traditional drivers now interact with modern market mechanics including algorithmic trading and derivatives exposure. The resulting volatility spike suggests traditional safe-havens may be losing their stability characteristics.
Related developments in tokenization infrastructure reflect this shifting . Robinhood's recent listing of PAXG represents growing institutional interest in gold tokenization. Similarly, MetaMask's integration of tokenized assets via ONDO demonstrates how traditional and digital assets are converging on-chain amid current market conditions.
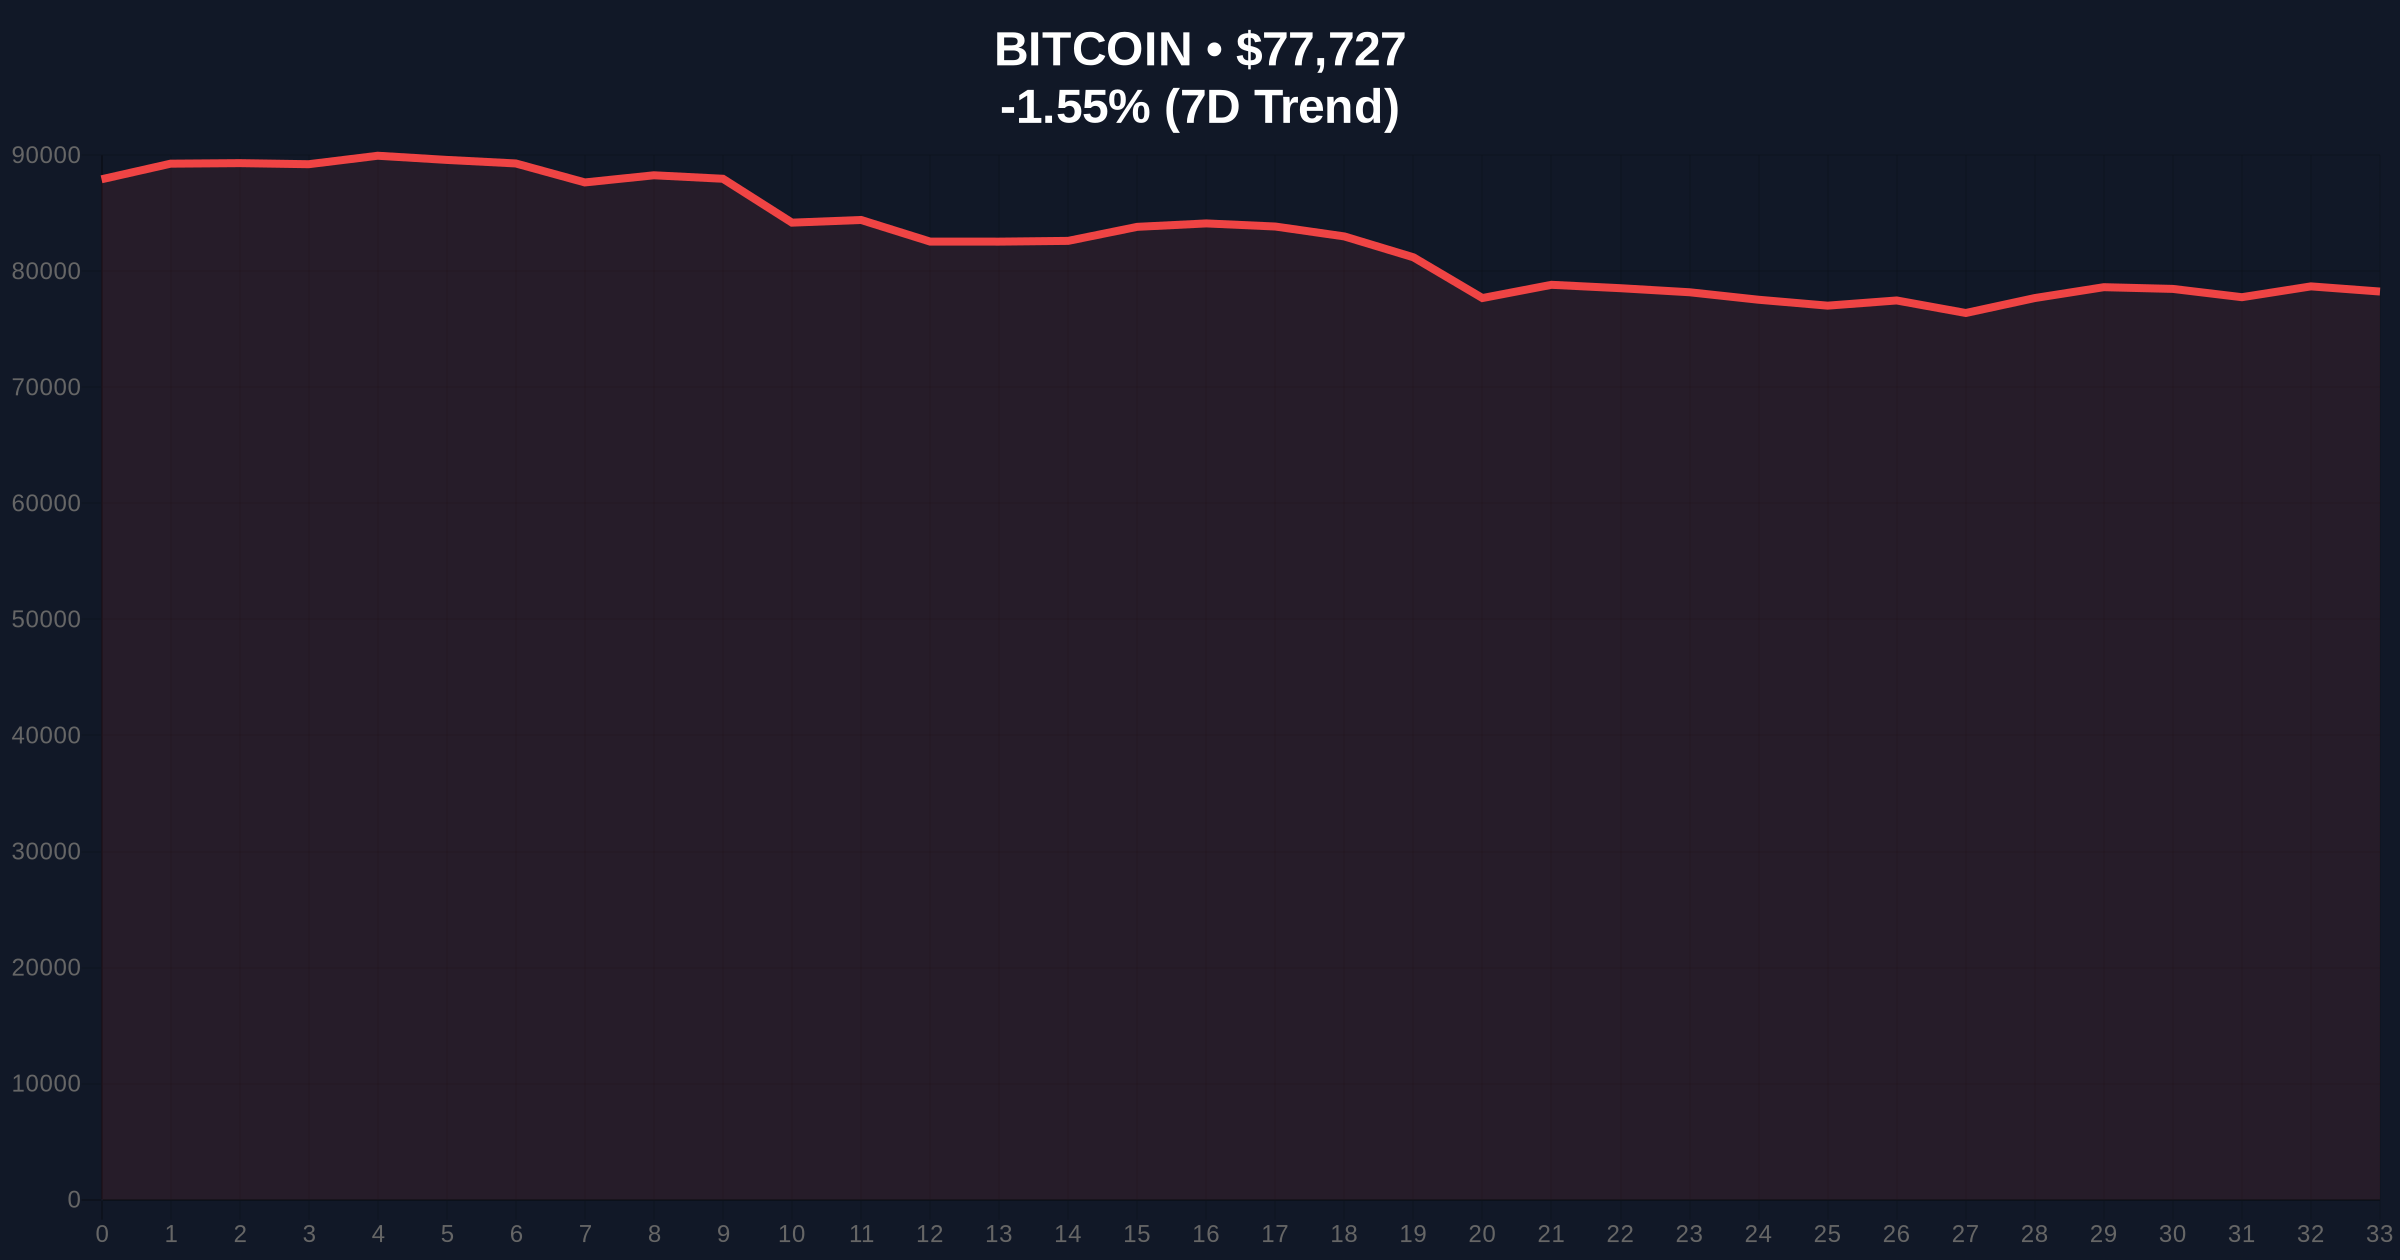
Bitcoin currently trades at $77,853 with a 24-hour decline of 1.38%. Technical analysis reveals critical Fibonacci levels from the 2024-2025 bull run. The 0.618 Fibonacci retracement level at $75,200 represents major support. This level coincides with the 200-day moving average, creating a confluence zone that must hold to maintain bullish structure.
Volume profile analysis shows significant liquidity accumulation between $74,000 and $76,000. This represents a Fair Value Gap (FVG) that price may revisit to fill order imbalances. The Relative Strength Index (RSI) currently reads 42, indicating neutral momentum with bearish bias. Market structure suggests Bitcoin needs to reclaim the $81,500 level to invalidate the current downtrend.
On-chain data from Glassnode indicates long-term holder supply has remained stable despite price volatility. The UTXO Realized Price Distribution (URPD) shows increased coin movement between $75,000 and $80,000, suggesting both accumulation and distribution at current levels. This creates a battleground zone that will determine next directional movement.
| Metric | Value | Context |
|---|---|---|
| Gold 30-Day Volatility | 44% | Highest since 2008 crisis |
| Bitcoin 30-Day Volatility | 39% | Lower than gold for first time in cycle |
| Bitcoin Current Price | $77,853 | 24h change: -1.38% |
| Crypto Fear & Greed Index | 17/100 (Extreme Fear) | Lowest reading in 6 months |
| Critical Fibonacci Support | $75,200 | 0.618 retracement level |
This volatility inversion matters because it challenges fundamental portfolio allocation models. Institutional investors traditionally allocate to gold during periods of market stress precisely for its stability characteristics. With gold now demonstrating higher volatility than Bitcoin, the risk-adjusted return calculus changes dramatically. Consequently, portfolio managers may reconsider their safe-haven allocations.
Market structure suggests this could accelerate capital rotation into digital assets. Bitcoin's network fundamentals remain robust with hash rate near all-time highs. The upcoming Bitcoin halving in 2028 will further reduce new supply issuance. These structural advantages contrast with gold's physical limitations and storage costs. The volatility divergence may therefore represent an inflection point in the store-of-value narrative.
"The volatility inversion between gold and Bitcoin represents a paradigm shift in risk assessment. Historical correlations are breaking down as digital and traditional assets respond differently to macroeconomic stimuli. This creates both challenges and opportunities for portfolio construction in the coming quarters."— CoinMarketBuzz Intelligence Desk
Two primary technical scenarios emerge from current market structure. The bullish scenario requires Bitcoin to hold the $75,200 Fibonacci support and reclaim $81,500 resistance. This would confirm the current pullback as a healthy correction within an ongoing bull trend. The bearish scenario involves breaking below $75,200 and testing the $70,000 psychological level.
The 12-month institutional outlook remains cautiously optimistic despite current volatility. According to Federal Reserve monetary policy documentation, interest rate cycles typically last 18-24 months. The current tightening phase may be approaching its conclusion, which historically precedes risk asset rallies. Bitcoin's fixed supply schedule and growing institutional adoption provide structural tailwinds that could outweigh short-term volatility concerns.

Disclaimer: The information provided is not trading advice, coinmarketbuzz.com holds no liability for any investments made based on the information provided on this page. We strongly recommend independent research and/or consultation with a qualified professional before making any investment decisions.
coinmarketbuzz.com leverages advanced AI technology to analyze market data. All content is fact-checked and reviewed by our editorial team to ensure accuracy and neutrality.