Loading News...
Loading...
Loading News...

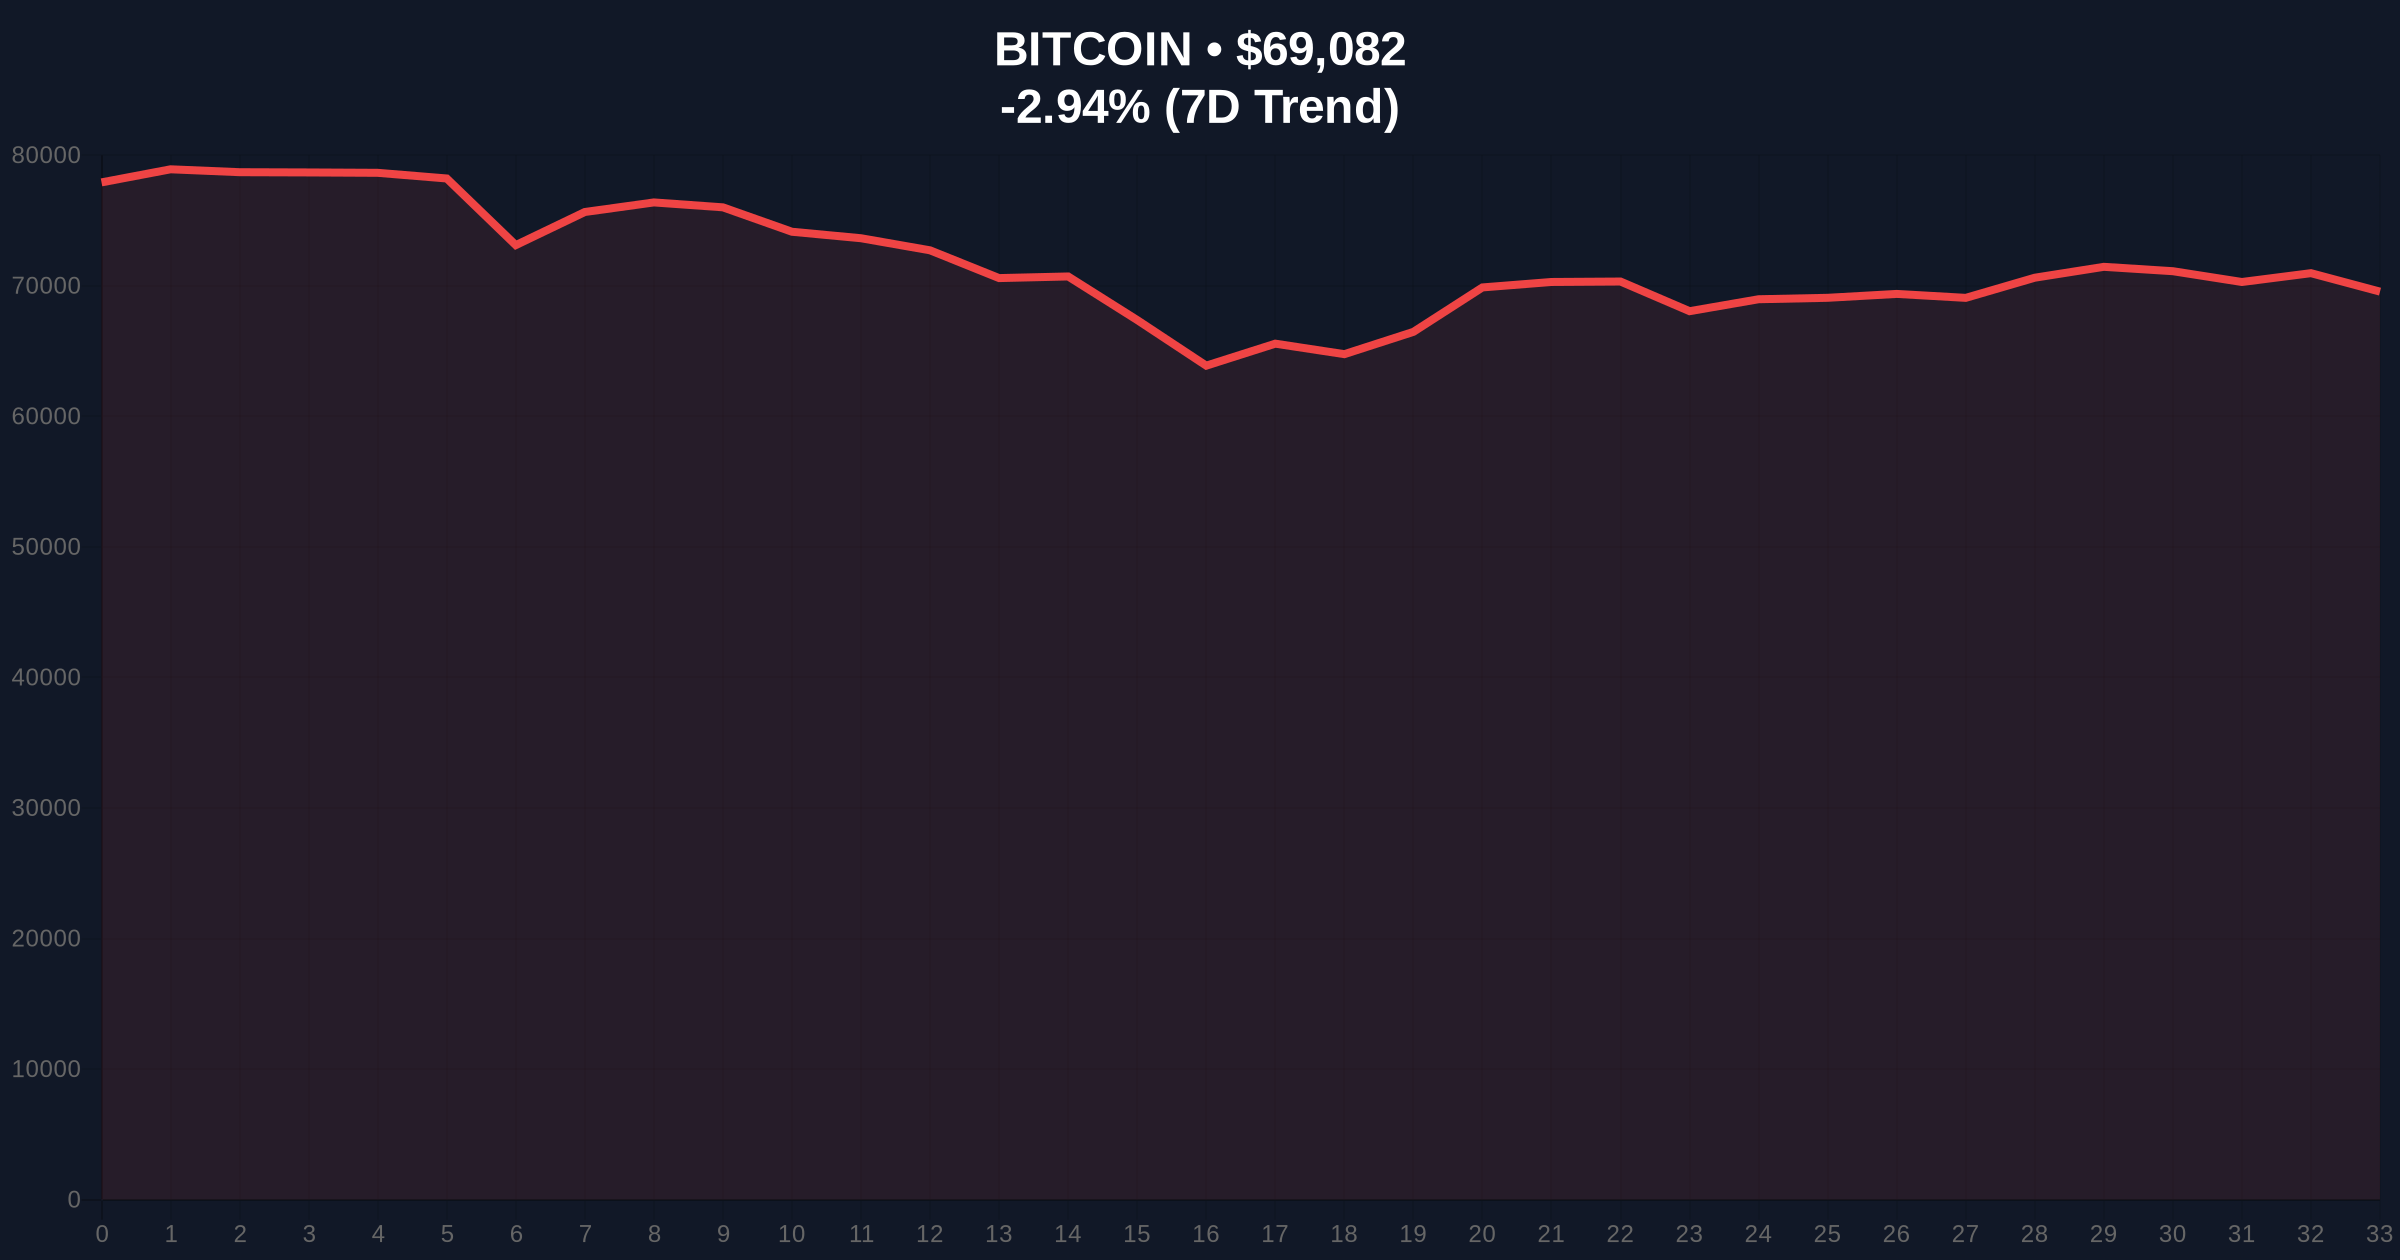
VADODARA, February 9, 2026 — According to on-chain analytics firm Glassnode, a Bitcoin price decline to the $70,000 level would generate approximately 16% of the asset's total market capitalization in unrealized losses. This daily crypto analysis reveals a potential $1.1 trillion paper loss event, with the firm noting the current market structure mirrors patterns observed in early May 2022—a period preceding significant downside volatility.
Glassnode's analysis, based on its proprietary on-chain data models, quantifies the unrealized loss magnitude. At a Bitcoin price of $70,000, the aggregate unrealized loss across all wallets would equate to roughly 16% of Bitcoin's total market cap. Given Bitcoin's current market capitalization of approximately $6.9 trillion, this translates to a staggering $1.1 trillion in paper losses. The firm explicitly states this environment shows "a pattern similar to that of early May 2022." That period saw Bitcoin decline from $40,000 to below $30,000 within weeks, following the collapse of the Terra-Luna ecosystem.
Consequently, this analysis serves as a stark warning for leveraged positions and overextended portfolios. The $70,000 level now represents a critical liquidity grab zone where stop-loss orders and margin calls could concentrate.
Historically, unrealized loss metrics of this scale precede heightened selling pressure. The May 2022 comparison is particularly instructive. Underlying that trend was a confluence of macroeconomic tightening and a breakdown in crypto-native leverage. The current parallel suggests similar fragility exists within derivative markets and among over-leveraged institutional holders.
, this analysis arrives amid other significant market developments. For instance, recent Bitcoin derivatives selling pressure has intensified ahead of key economic data. Simultaneously, entities like Cango have engaged in large-scale selling to manage liabilities, as detailed in our report on Cango selling 4,451 BTC to repay loans, sparking fears of broader miner capitulation. These events collectively pressure the $69,000 support level.
Market structure suggests the $69,000-$70,000 band is a major order block. A break below this zone would invalidate the higher-timeframe bullish structure established after the last halving. The 200-day moving average, a key institutional benchmark, currently sits near $68,500, adding confluence. The Relative Strength Index (RSI) on daily charts is approaching oversold territory, but capitulation events often drive it lower.
In contrast, the Fibonacci 0.618 retracement level from the 2024-2025 bull run sits at approximately $65,000, representing a deeper potential target if $69,000 fails. On-chain data indicates a significant volume profile node (high trading activity) between $67,000 and $70,000, meaning price discovery in this range could be volatile.
| Metric | Value | Source/Context |
|---|---|---|
| Bitcoin Current Price | $69,051 | Live Market Data |
| 24-Hour Price Change | -2.79% | Live Market Data |
| Crypto Fear & Greed Index | 14/100 (Extreme Fear) | Alternative.me |
| Projected Unrealized Loss at $70K | 16% of Market Cap (~$1.1T) | Glassnode Analysis |
| Historical Comparison Period | Early May 2022 | Glassnode |
This matters because unrealized losses directly impact investor psychology and market liquidity. When paper losses approach a critical mass, they often transform into realized losses through panic selling. This creates a negative feedback loop: selling begets more selling, draining liquidity from the order books. For the 5-year horizon, understanding these capitulation thresholds is essential for identifying cycle bottoms and subsequent accumulation phases.
Institutional liquidity cycles typically pause during such events, as seen in Q2 2022. Retail market structure, often dominated by high-leverage futures positions, is most vulnerable. A move to $70,000 could trigger a gamma squeeze in options markets, exacerbating downward momentum as dealers hedge their exposure.
"The Glassnode metric is a cold, mathematical warning sign. A 16% unrealized loss relative to market cap indicates a significant portion of the supply is held at a loss near current prices. Historically, when this metric spikes alongside extreme fear sentiment, it either marks a local bottom or precedes a final capitulation washout. The key is monitoring on-chain spending behavior and exchange inflows for confirmation." – CoinMarketBuzz Intelligence Desk
Based on current market structure, two primary technical scenarios emerge.
The 12-month institutional outlook hinges on whether this potential loss event leads to a healthy deleveraging or a prolonged bear market. If history is a guide, such shakeouts, while painful, often create the foundation for the next leg up by transferring assets from weak to strong hands. However, the macro backdrop, including Federal Reserve policy as detailed on FederalReserve.gov, will be the ultimate arbiter of capital flows.

Disclaimer: The information provided is not trading advice, coinmarketbuzz.com holds no liability for any investments made based on the information provided on this page. We strongly recommend independent research and/or consultation with a qualified professional before making any investment decisions.
coinmarketbuzz.com leverages advanced AI technology to analyze market data. All content is fact-checked and reviewed by our editorial team to ensure accuracy and neutrality.