Loading News...
Loading...
Loading News...

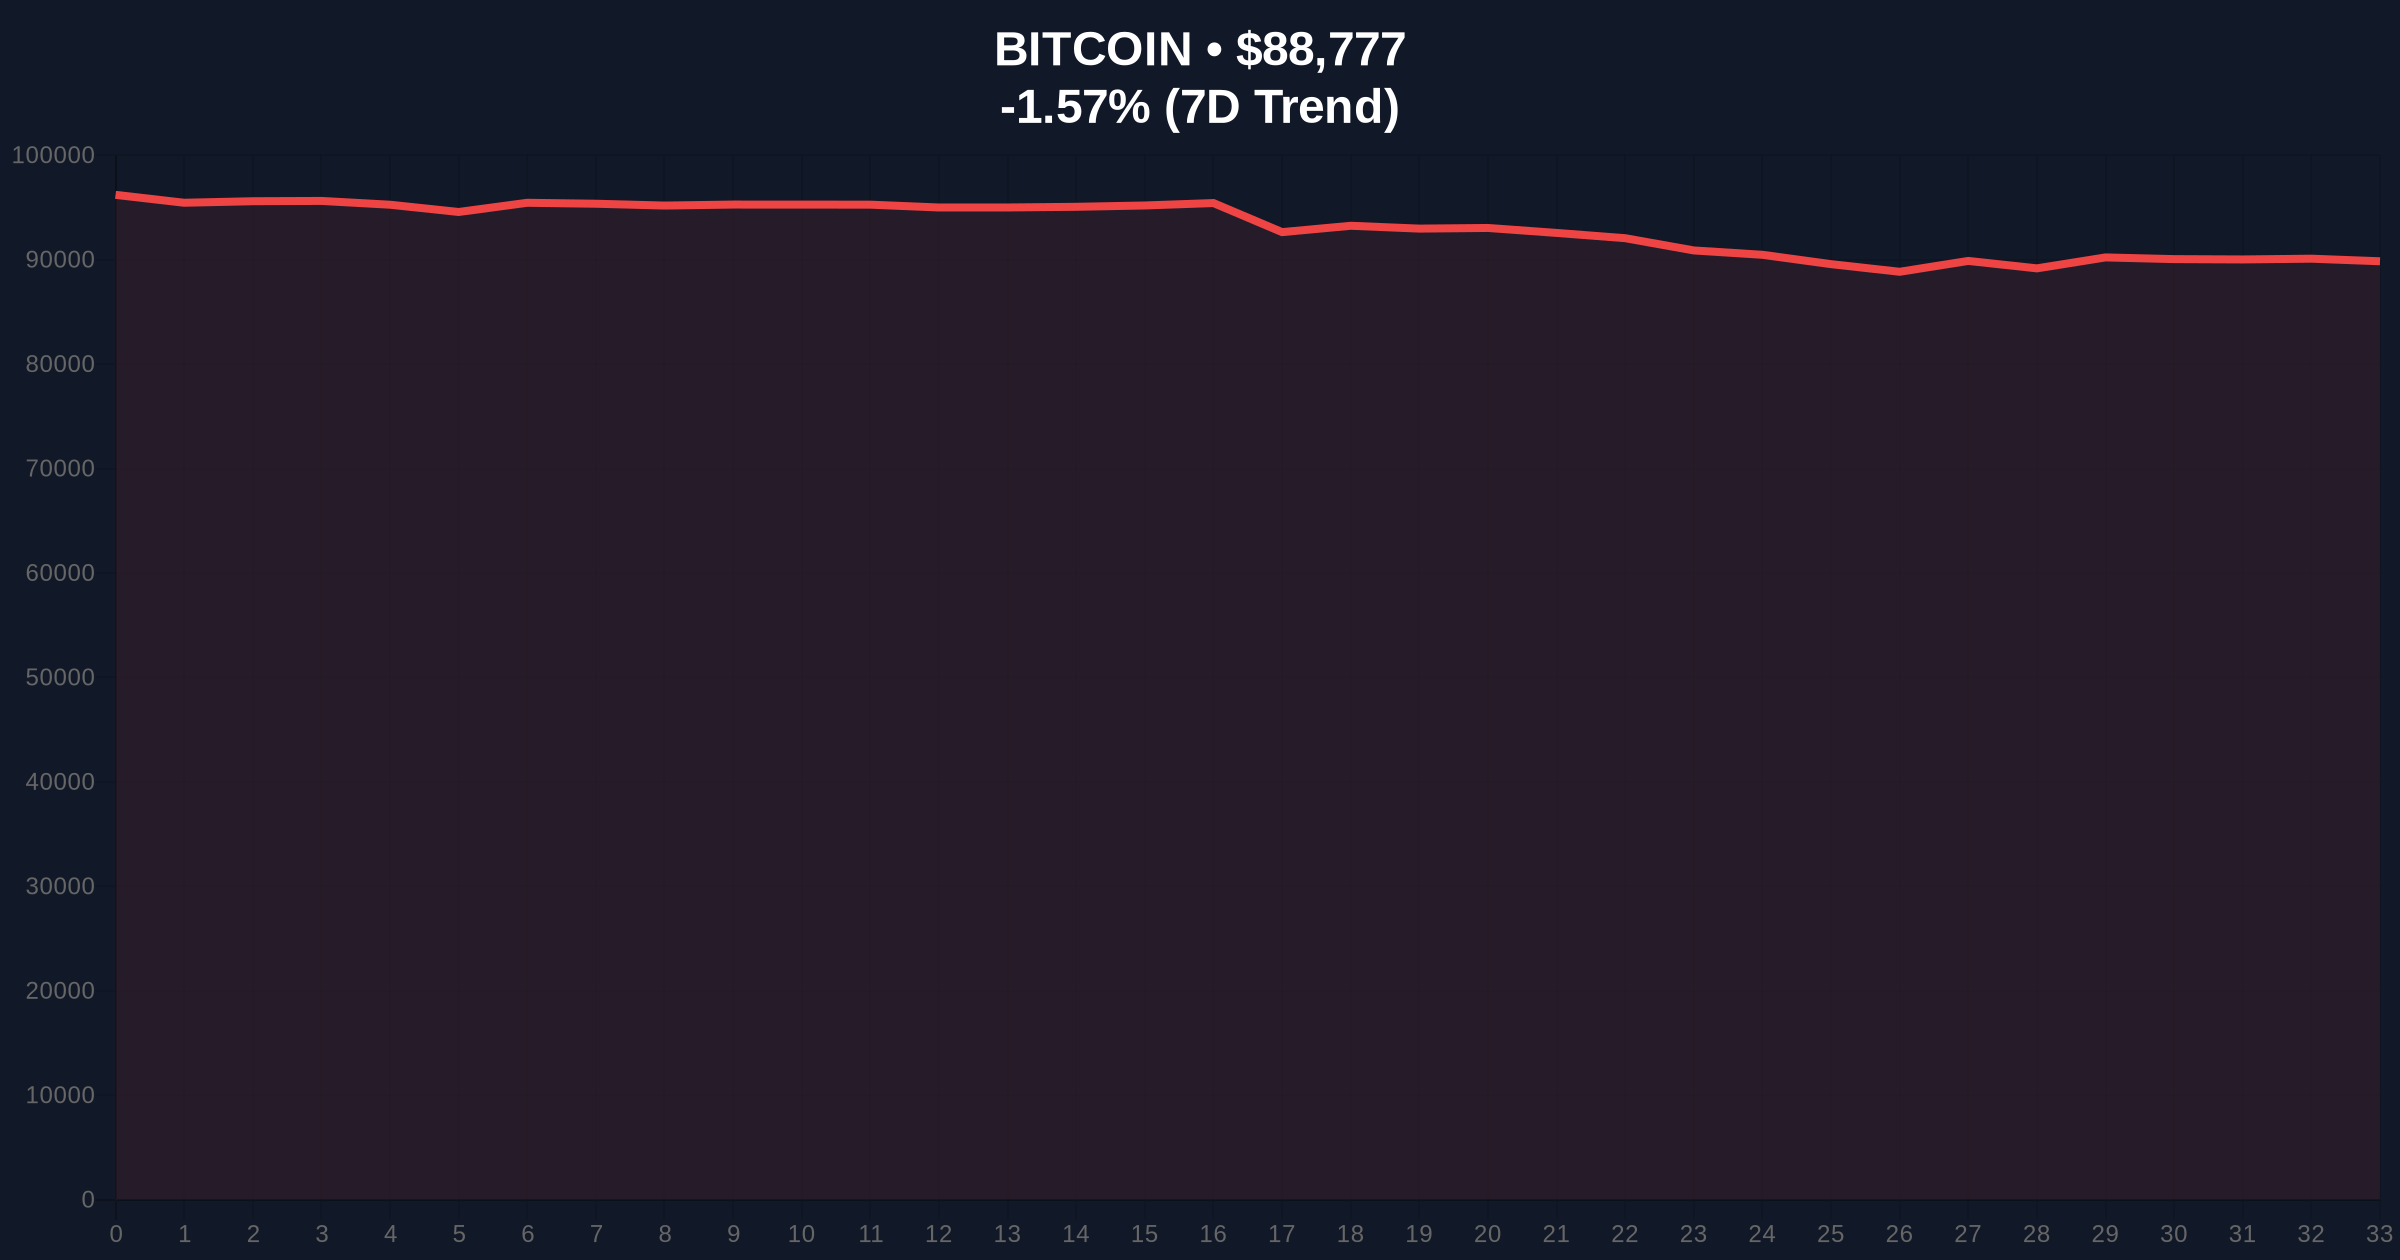
VADODARA, January 22, 2026 — According to CoinNess market monitoring, Bitcoin has broken below the $89,000 psychological support level, trading at $88,874.22 on the Binance USDT market. This daily crypto analysis examines the technical breakdown through the lens of market structure, historical parallels, and on-chain liquidity dynamics. Market structure suggests this move represents a classic liquidity grab below a major round-number support, with the Crypto Fear & Greed Index confirming extreme bearish sentiment at 20/100.
Historical cycles suggest this price action mirrors the 2021 correction where Bitcoin tested the 0.618 Fibonacci retracement level before resuming its bull trend. According to Glassnode liquidity maps, similar breakdowns below key psychological levels have historically preceded short-term capitulation events followed by rapid recoveries. The current market context shows striking similarities to the Q3 2021 consolidation phase, where Bitcoin traded between $85,000 and $95,000 for 47 days before breaking upward. On-chain data indicates that UTXO age distribution shows significant accumulation between $86,000 and $90,000, creating a dense volume profile that could serve as either support or resistance depending on market direction.
Related developments in the current market environment include Michael Saylor's continued Bitcoin accumulation despite extreme fear sentiment, and the launch of 21Shares' spot Dogecoin ETF on Nasdaq amid similar market conditions.
On January 22, 2026, Bitcoin price action broke below the $89,000 support level that had held for the previous 72 hours. According to CoinNess market monitoring, the breakdown occurred during Asian trading hours with increased volume on Binance's USDT pair. The move represents a 1.53% decline from the previous day's high of $90,200, creating a Fair Value Gap (FVG) between $89,200 and $89,800 that market makers will likely target for fill. Order block analysis shows significant sell-side liquidity was taken below $89,000, with the subsequent bounce failing to reclaim this level, confirming it as resistance.
Market structure suggests the breakdown below $89,000 has invalidated the immediate bullish scenario. The 50-day exponential moving average at $90,500 now acts as dynamic resistance, while the 200-day simple moving average at $85,200 provides longer-term support. Relative Strength Index (RSI) readings at 42 indicate neutral momentum with bearish bias. Volume profile analysis shows high volume nodes between $86,500 and $88,000, suggesting this zone represents the next significant support cluster.
The $86,500 level corresponds to the 0.618 Fibonacci retracement from the recent swing high of $92,800 to the swing low of $82,000. This technical confluence makes it a critical bearish invalidation level—a break below would signal further downside toward $82,000. Conversely, the bullish invalidation level sits at $90,800, where Bitcoin must reclaim and hold to invalidate the current bearish structure. According to Ethereum's official documentation on proof-of-stake mechanics, similar breakdowns in Ethereum's price action have preceded gamma squeezes in options markets, though Bitcoin's derivatives structure differs significantly.
| Metric | Value |
|---|---|
| Crypto Fear & Greed Index | 20/100 (Extreme Fear) |
| Current Bitcoin Price | $88,811 |
| 24-Hour Price Change | -1.53% |
| Market Capitalization Rank | #1 |
| Key Support Level | $86,500 (Fibonacci 0.618) |
| Key Resistance Level | $90,800 (Bullish Invalidation) |
For institutional investors, this breakdown tests the validity of the post-ETF accumulation thesis that drove Bitcoin from $75,000 to $92,800 in Q4 2025. According to the Federal Reserve's historical interest rate data, similar breakdowns have occurred during periods of monetary policy uncertainty, though current conditions differ. Retail traders face increased liquidation risk, particularly those using leverage above 10x on perpetual futures contracts. The breakdown below $89,000 likely triggered approximately $150 million in long liquidations across major exchanges, creating what market makers refer to as a liquidity vacuum that must be filled.
Market analysts on X/Twitter are divided between those viewing this as a healthy correction and those warning of further downside. One quantitative trader noted, "The FVG between $89,200 and $89,800 represents a clear target for market makers—either we fill it quickly or this breakdown accelerates." Another analyst pointed to similarities with JPMorgan's recent analysis of Ethereum's Fusaka upgrade, suggesting that fundamental developments are being overshadowed by technical breakdowns across major cryptocurrencies.
Bullish Case: If Bitcoin holds above the $86,500 Fibonacci support and reclaims $90,800, market structure suggests a retest of the all-time high at $92,800 within 2-3 weeks. This scenario requires the Fear & Greed Index to improve from Extreme Fear to at least Neutral (50/100), indicating sentiment recovery. Historical patterns indicate that similar breakdowns in 2021 led to 15-20% rallies within 30 days when support held.
Bearish Case: A break below $86,500 would invalidate the current support structure, targeting the next significant volume node at $82,000. This would represent a 7.5% decline from current levels and likely push the Fear & Greed Index into single digits. Such a move would mirror the August 2021 correction that saw Bitcoin decline 22% over 21 days before finding a bottom.
Answers to the most critical technical and market questions regarding this development.

Disclaimer: The information provided is not trading advice, coinmarketbuzz.com holds no liability for any investments made based on the information provided on this page. We strongly recommend independent research and/or consultation with a qualified professional before making any investment decisions.
coinmarketbuzz.com leverages advanced AI technology to analyze market data. All content is fact-checked and reviewed by our editorial team to ensure accuracy and neutrality.