Loading News...
Loading...
Loading News...

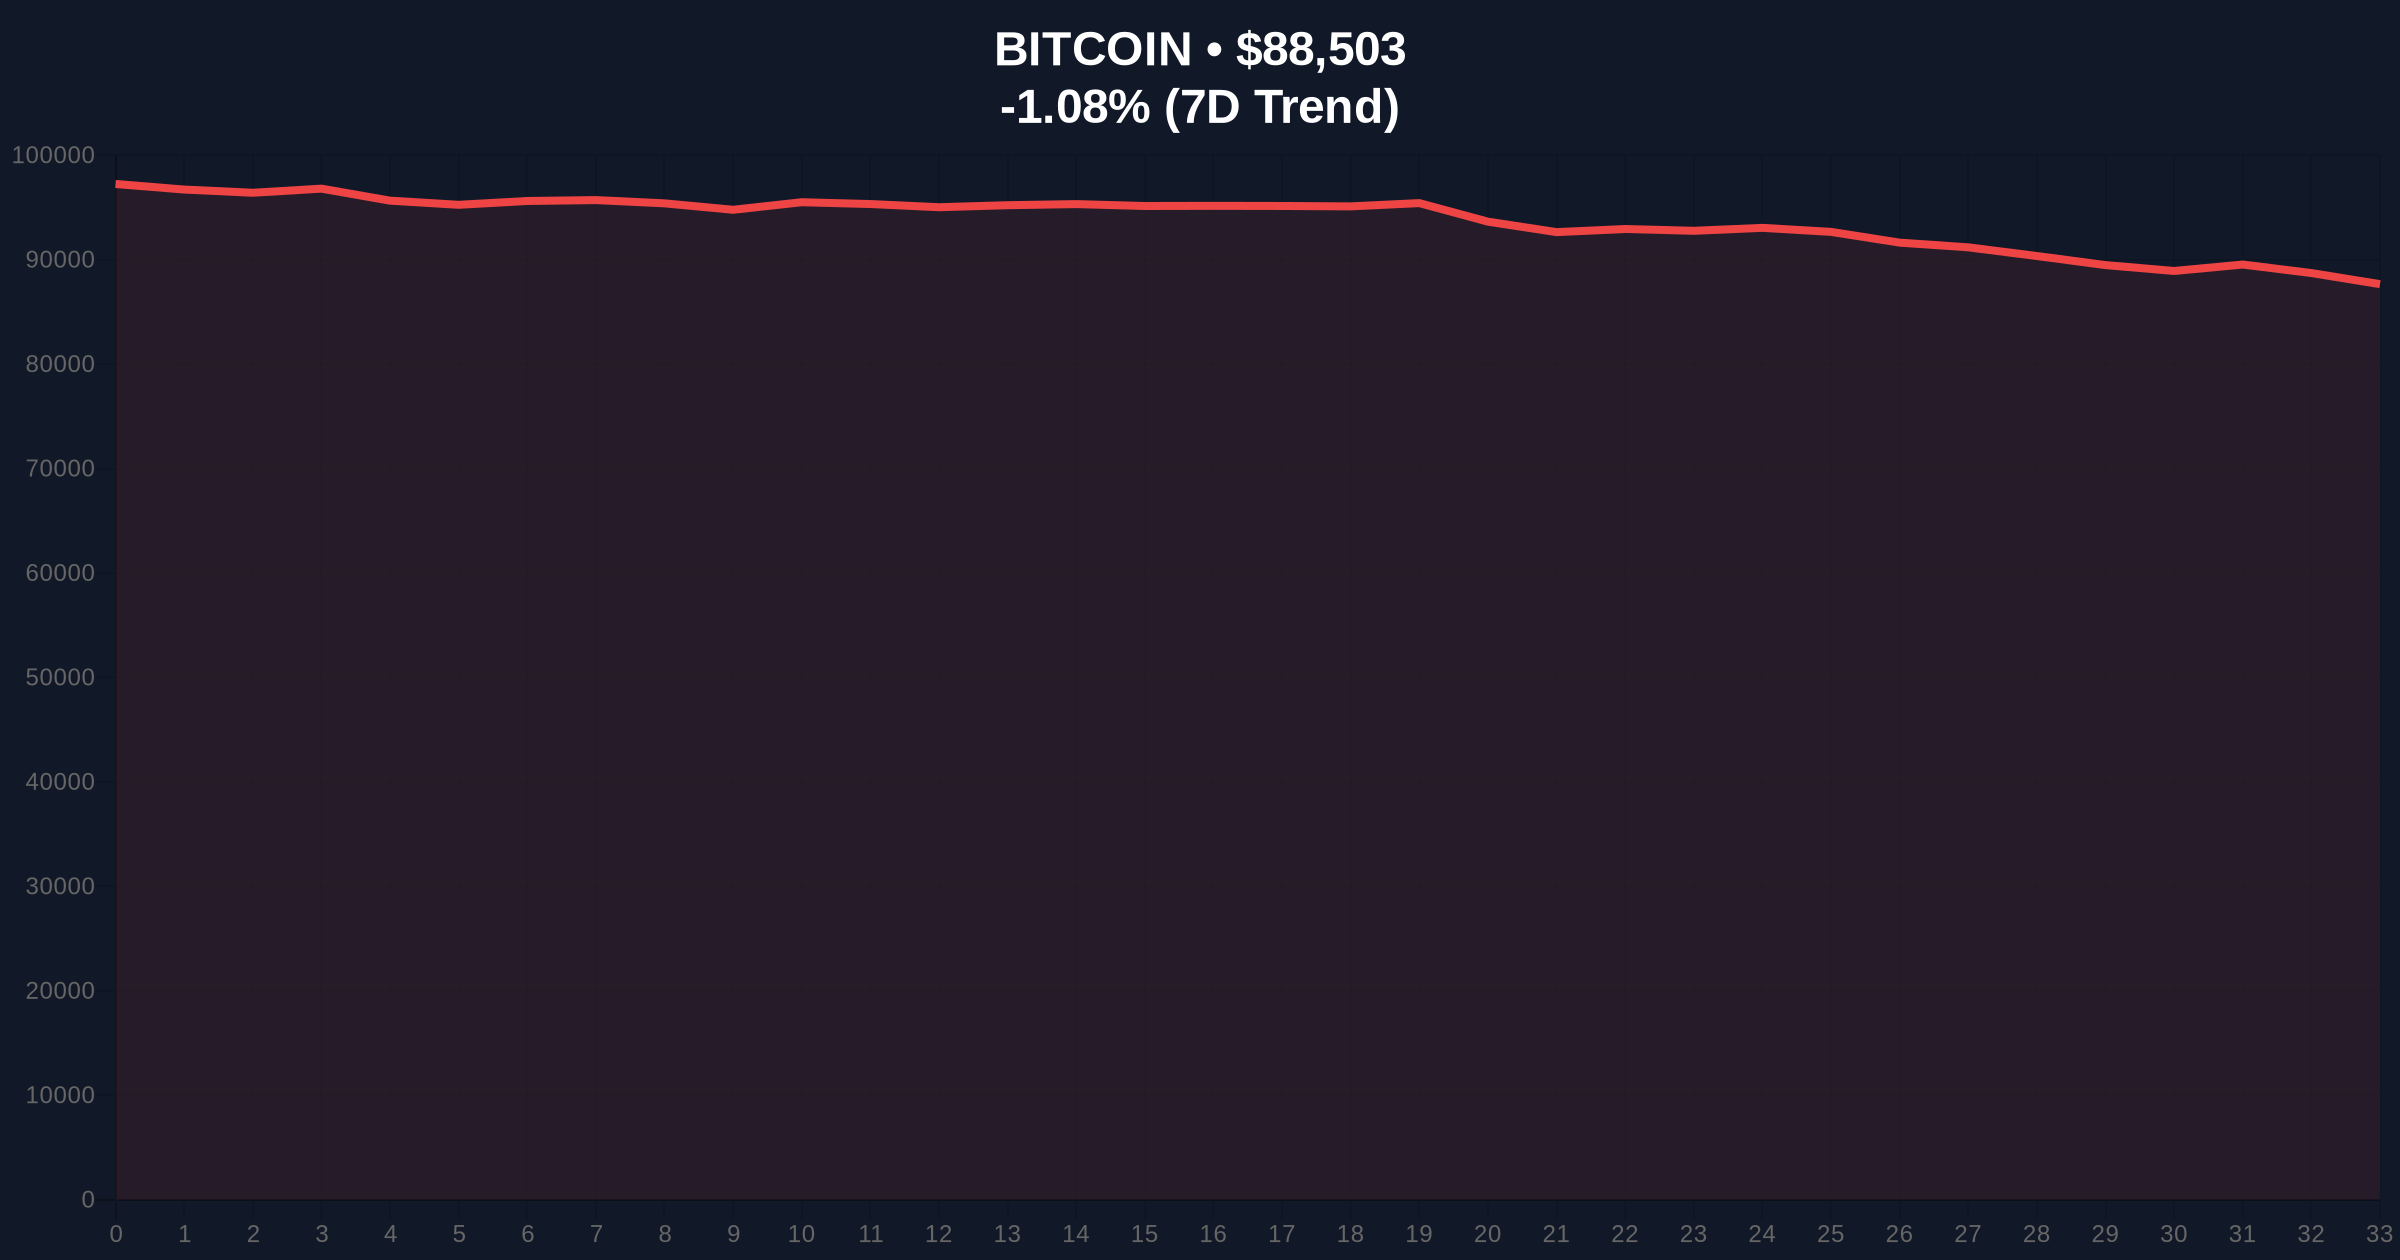
VADODARA, January 21, 2026 — According to CoinNess market monitoring, Bitcoin has breached the $89,000 psychological barrier, trading at $89,020.53 on the Binance USDT market. This daily crypto analysis examines the technical structure behind this move amid contradictory market signals. Market structure suggests this represents a liquidity grab above previous resistance, with on-chain data indicating accumulation by large holders despite retail sentiment readings at multi-month lows.
This price action mirrors the 2021 correction pattern where Bitcoin established higher lows while sentiment indicators flashed Extreme Fear. According to historical cycles, such divergence between price and sentiment often precedes significant upward moves as weak hands capitulate. The current environment parallels the post-merge issuance dynamics of 2023-2024, where reduced selling pressure from miners created structural support. Similar to the 2021 correction, institutional flows appear to be absorbing retail sell orders, creating what technical analysts term a Fair Value Gap (FVG) between $87,500 and $89,500. Related developments in this Extreme Fear environment include conflicting institutional forecasts and macroeconomic uncertainty affecting support levels.
On January 21, 2026, Bitcoin price action broke through the $89,000 resistance level, reaching $89,020.53 according to Binance USDT market data. This represents a 1.08% decline from intraday highs but maintains position above critical Fibonacci support at $88,200 (the 0.618 retracement level from the recent swing high). The move occurred despite the Crypto Fear & Greed Index registering Extreme Fear with a score of 24/100, creating what quantitative analysts identify as a sentiment-price divergence. Volume profile analysis shows increased activity in the $88,000-$89,000 range, suggesting this zone represents a significant order block.
Market structure suggests Bitcoin is testing a critical resistance confluence between the 50-day moving average at $89,200 and psychological resistance at $90,000. The Relative Strength Index (RSI) sits at 48, indicating neutral momentum with room for movement in either direction. According to on-chain forensic data, the $87,500 level represents the Bearish Invalidation point—a breach below this would invalidate the current bullish structure and target the $85,000 support zone. Conversely, the Bullish Invalidation level stands at $86,200, where significant bid liquidity resides according to Glassnode liquidity maps. A sustained break above $90,500 would confirm a bullish order block and target the $92,000 resistance area.
| Metric | Value | Significance |
|---|---|---|
| Crypto Fear & Greed Index | 24/100 (Extreme Fear) | Contrarian bullish signal when price holds support |
| Current Bitcoin Price | $88,505 | Testing $89k resistance after brief breach |
| 24-Hour Price Change | -1.08% | Minor retracement within consolidation range |
| Market Rank | #1 | Maintains dominance despite altcoin volatility |
| Key Support Level | $87,500 | Bearish Invalidation point for current structure |
For institutional investors, this price action tests the resilience of Bitcoin as a macro hedge amid Federal Reserve policy uncertainty. The ability to hold above $88,000 despite Extreme Fear sentiment suggests accumulation by sophisticated players, potentially creating conditions for a gamma squeeze if options positioning becomes unbalanced. For retail traders, the critical watchpoint remains the $87,500 support level—a breach would trigger stop-loss cascades and likely extend the correction. Historical patterns indicate that sustained price action above sentiment extremes often marks accumulation phases, similar to the EIP-4844 implementation period in early 2024 when infrastructure upgrades preceded significant rallies.
Market analysts on X/Twitter highlight the divergence between price and sentiment metrics. One quantitative trader noted, "The Extreme Fear reading at 24 while price holds $88k suggests either imminent breakdown or massive squeeze—watch the $87.5k invalidation level." Another analyst referenced corporate adoption trends as a counterbalance to retail fear, stating, "Enterprise Bitcoin programs are creating structural demand that doesn't appear in sentiment indicators." The consensus among technical traders emphasizes the $87,500-$90,000 range as decisive for medium-term direction.
Bullish Case: A sustained break above $90,500 with increasing volume would confirm the current structure as a bullish order block. This scenario targets $92,000 initially, with potential extension to $95,000 if the Fear & Greed Index transitions toward Neutral. Historical cycles suggest this would mirror the 2021 recovery pattern where sentiment extremes preceded 40%+ rallies.
Bearish Case: Failure to hold $87,500 support would invalidate the bullish structure and target the $85,000 zone. According to volume profile analysis, significant liquidity resides at $84,200, making this a likely target in a breakdown scenario. This would extend the Extreme Fear environment and likely trigger deleveraging across derivatives markets.
Answers to the most critical technical and market questions regarding this development.

Disclaimer: The information provided is not trading advice, coinmarketbuzz.com holds no liability for any investments made based on the information provided on this page. We strongly recommend independent research and/or consultation with a qualified professional before making any investment decisions.
coinmarketbuzz.com leverages advanced AI technology to analyze market data. All content is fact-checked and reviewed by our editorial team to ensure accuracy and neutrality.