Loading News...
Loading...
Loading News...

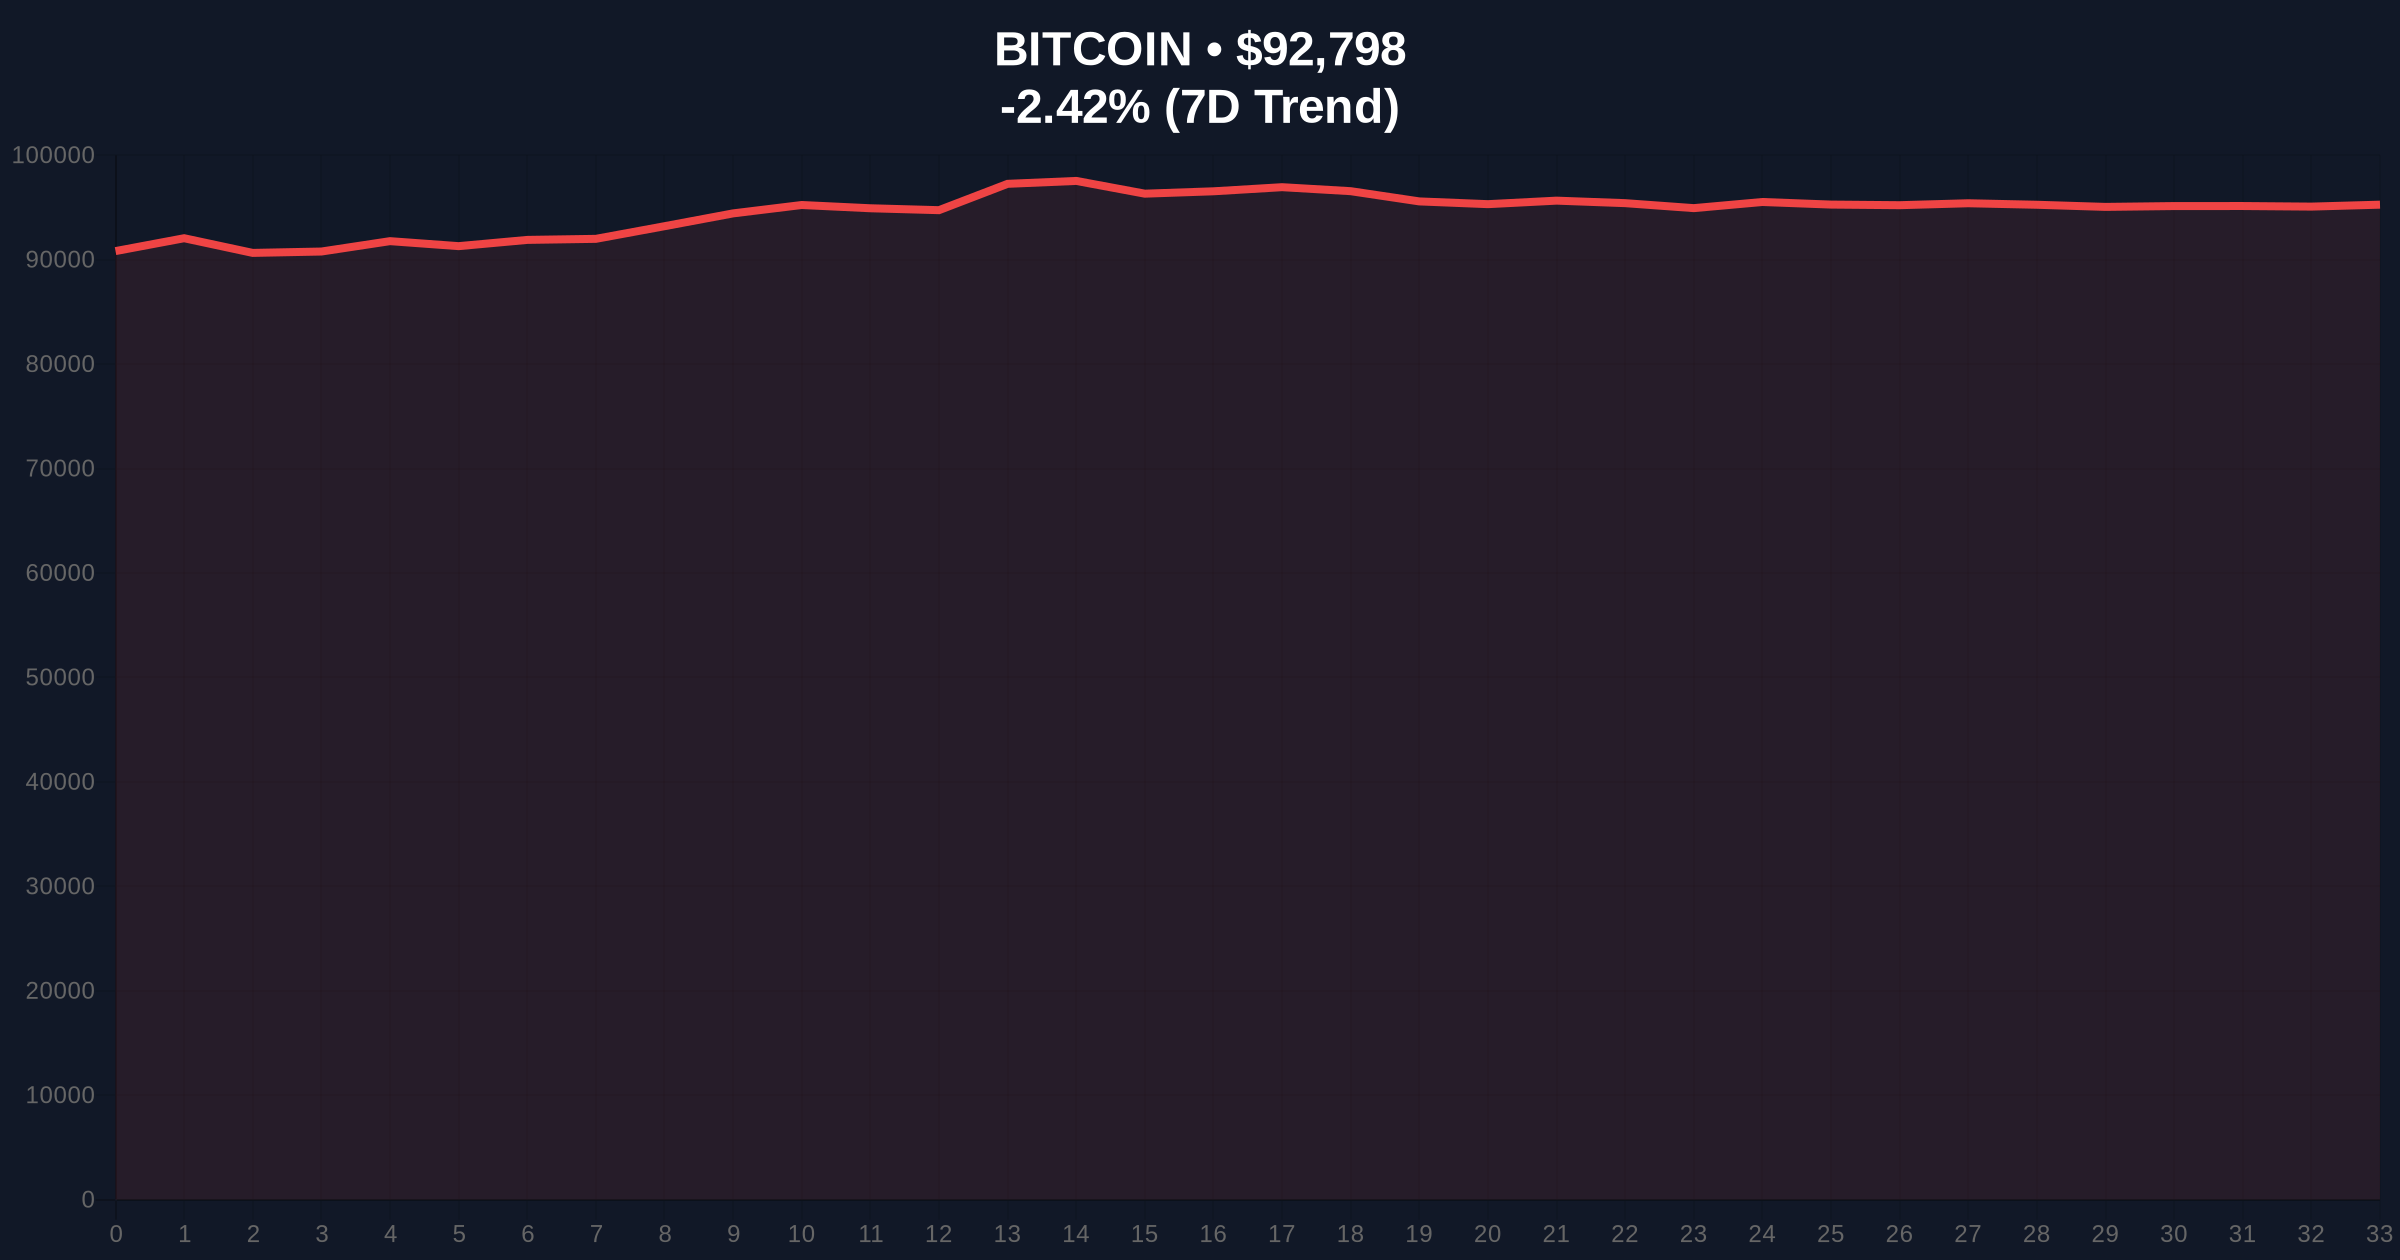
VADODARA, January 19, 2026 — Bitcoin's Bitcoin price action has entered a critical phase as the asset breached the $92,000 psychological support level, trading at $91,950.04 on Binance's USDT market according to CoinNess market monitoring. This movement represents more than a simple price decline; market structure suggests a potential liquidity grab targeting weak hands below key technical levels.
This price action mirrors the 2021 correction where Bitcoin tested the 0.618 Fibonacci retracement level before establishing a new accumulation zone. Historical cycles indicate that breaks below round-number psychological supports often precede either swift recoveries through short squeezes or extended consolidation periods. The current environment features contradictory on-chain signals, with accumulation patterns showing strength while price action demonstrates weakness—a divergence that typically resolves through volatile movements. Similar to the post-FTX accumulation phase, large addresses have been adding positions, but this has not translated into immediate price support, creating a Fair Value Gap (FVG) between on-chain fundamentals and spot market pricing.
Related Developments:
According to primary data from CoinNess, Bitcoin's price declined through the $92,000 threshold on January 19, 2026, establishing a new local low at $91,950.04. This represents a -2.32% 24-hour decline from previous levels, with the move occurring during Asian trading hours when liquidity typically thins. The breach occurred without significant volume spikes on most exchanges, suggesting either algorithmic selling or stop-loss cascades rather than fundamental capitulation. Market analysts attribute this to a combination of technical breakdown and macro uncertainty, though no single catalyst has been identified in official statements.
Market structure suggests the $92,000 level acted as a previous Order Block from earlier accumulation, with its breach creating an imbalance that must be filled. The Volume Profile indicates significant liquidity pools between $90,500 and $91,000, making this zone critical for determining next direction. The 50-day moving average at $93,400 now acts as resistance, while the 200-day at $88,200 provides longer-term support. RSI readings at 42 suggest neutral momentum with room for further downside before oversold conditions emerge.
Bullish Invalidation Level: A sustained break below $90,500 (0.786 Fibonacci of the recent swing) would invalidate any immediate bullish recovery thesis, suggesting targeting of the $88,200 200-day MA.
Bearish Invalidation Level: A reclaim above $93,400 (50-day MA) with volume would negate the current breakdown, potentially triggering a Gamma Squeeze through short covering.
| Metric | Value |
|---|---|
| Crypto Fear & Greed Index | Fear (44/100) |
| Current Bitcoin Price | $92,892 |
| 24-Hour Change | -2.32% |
| Market Rank | #1 |
| Key Support Level | $90,500 (Fibonacci) |
For institutional portfolios, this breakdown tests the viability of $92,000 as a strategic accumulation zone. According to Federal Reserve historical data, tightening cycles typically pressure risk assets, and Bitcoin's correlation with traditional markets has increased since 2023. Retail traders face margin call risks at these levels, particularly those using excessive leverage in perpetual futures markets. The breach also impacts Bitcoin ETF flows, as sustained weakness below psychological levels often triggers outflows from trend-following products.
Market analysts on X/Twitter are divided: bulls point to the post-merge issuance schedule reducing sell pressure, while bears highlight regulatory uncertainty. One quantitative trader noted, "This looks like a classic liquidity grab below $92k—if it holds, we could see a violent reversal." Others reference the Immunefi security report indicating systemic risks in crypto, suggesting broader market fragility beyond just price action.
Bullish Case: If $90,500 Fibonacci support holds, market structure suggests a reversal toward $95,000 to fill the FVG created by the breakdown. This scenario requires reclaiming the 50-day MA with increasing spot volume, potentially driven by institutional accumulation as seen in recent on-chain data.
Bearish Case: A break below $90,500 targets the $88,200 200-day moving average, with potential extension to $85,000 if macro conditions worsen. This would represent a -8% decline from current levels, aligning with historical corrections during similar technical breakdowns.
Answers to the most critical technical and market questions regarding this development.

Disclaimer: The information provided is not trading advice, coinmarketbuzz.com holds no liability for any investments made based on the information provided on this page. We strongly recommend independent research and/or consultation with a qualified professional before making any investment decisions.
coinmarketbuzz.com leverages advanced AI technology to analyze market data. All content is fact-checked and reviewed by our editorial team to ensure accuracy and neutrality.