Loading News...
Loading...
Loading News...

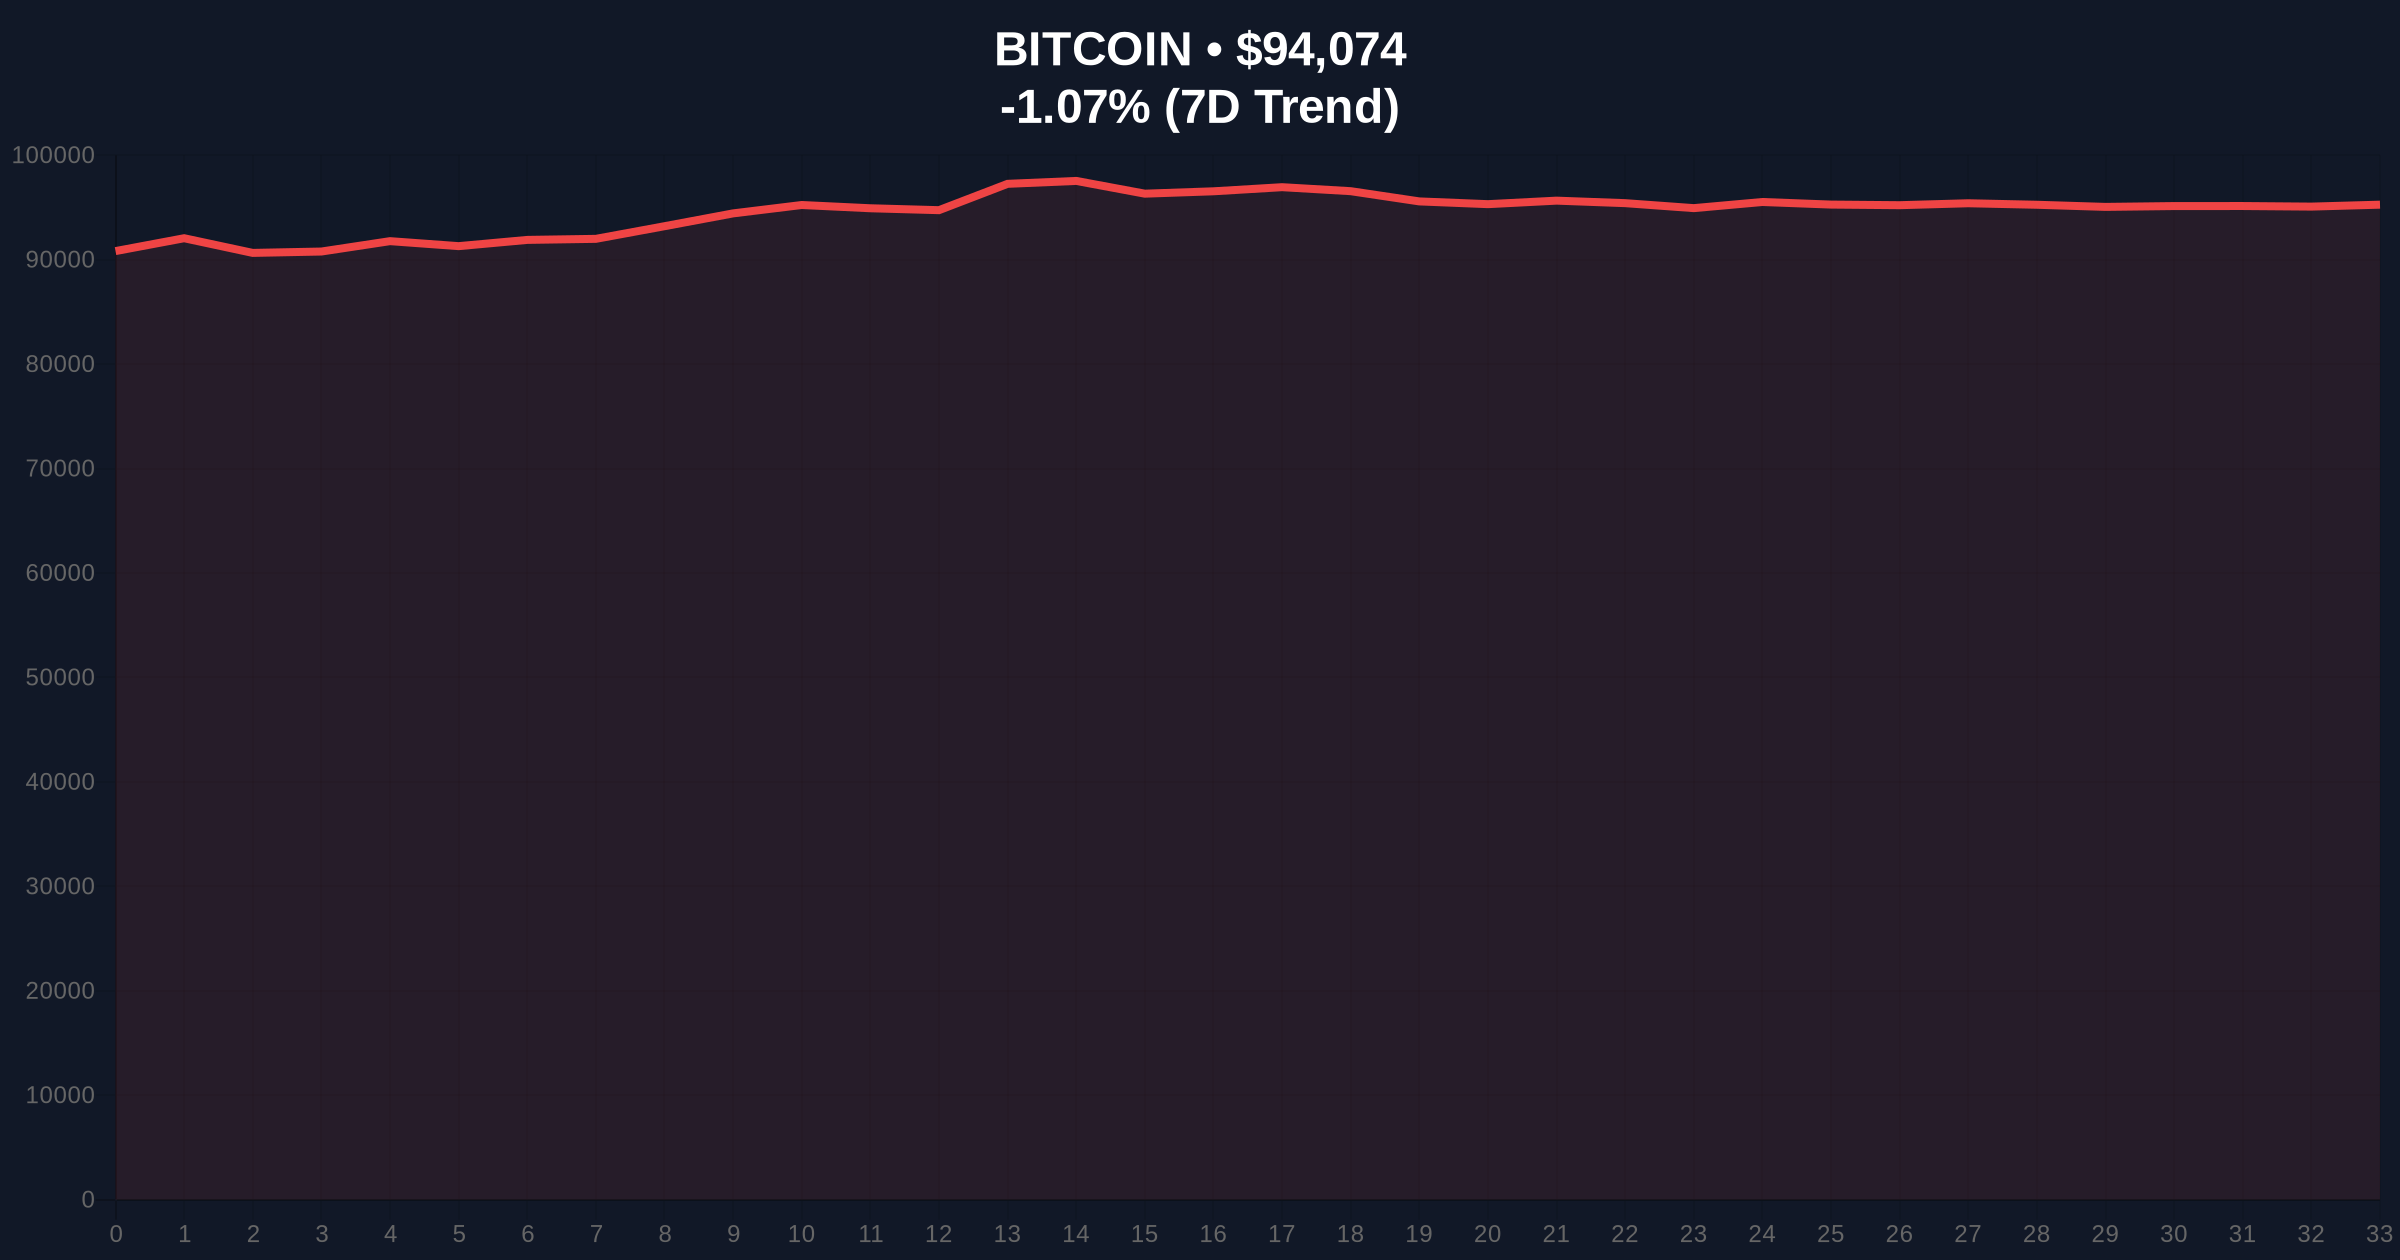
VADODARA, January 19, 2026 — According to CoinNess market monitoring, Bitcoin has broken below the $94,000 psychological level, trading at $93,897.37 on the Binance USDT market. This daily crypto analysis examines whether this represents a standard correction or the beginning of a deeper structural shift. Market structure suggests this price action creates a Fair Value Gap (FVG) between $93,200 and $94,500 that must be monitored for liquidity grabs.
This price movement occurs against a backdrop of conflicting market narratives. While price action shows weakness, on-chain accumulation patterns tell a different story. According to Glassnode liquidity maps, Bitcoin's UTXO age distribution indicates significant accumulation by mid-to-large investors, creating a potential supply squeeze scenario. This mirrors the 2021 cycle where price corrections coincided with institutional accumulation phases. The current test of $94,000 represents the third retest of this level in the past 30 trading sessions, suggesting it has evolved from resistance to a critical support zone. Related developments include recent data showing Bitcoin accumulation at post-FTX highs and ongoing debates about blockchain fundamentals highlighted in the Solana-Ethereum evolution discussion.
On January 19, 2026, Bitcoin's price action on the Binance USDT market showed a breakdown below the $94,000 level, reaching a low of $93,897.37. This represents a -0.73% decline over 24 hours according to real-time market intelligence. The move occurred during Asian trading hours, typically a period of lower liquidity that can exacerbate price movements. Volume profile analysis indicates the sell-off was accompanied by above-average volume in the $93,800-$94,200 range, suggesting this was not a random fluctuation but a deliberate liquidity grab. Market analysts attribute this to profit-taking at psychological resistance levels and potential gamma squeeze effects in options markets.
Market structure suggests Bitcoin is testing a critical order block between $92,500 and $93,000 that served as support during the November 2025 rally. The 50-day moving average currently sits at $92,800, creating a confluence zone. RSI readings at 48 indicate neutral momentum with slight bearish bias. The Fibonacci retracement from the December 2025 high of $98,500 to the January low of $91,200 shows the 61.8% level at $93,850—precisely where current price action is consolidating. This creates a textbook decision point for market direction. Bullish invalidation occurs if Bitcoin closes below $92,500 on a daily timeframe, while bearish invalidation requires a sustained break above $95,800 resistance. The Federal Reserve's latest statements on interest rate policy, available on FederalReserve.gov, suggest macroeconomic conditions remain supportive for risk assets, adding another layer of contradiction to the current price weakness.
| Metric | Value | Significance |
|---|---|---|
| Current Price | $94,402 | Testing $94k support zone |
| 24h Change | -0.73% | Minor correction within range |
| Crypto Fear & Greed Index | 49/100 (Neutral) | Contradicts bearish price action |
| Market Rank | #1 | Dominance remains unchallenged |
| Key Support Level | $92,500 | Bullish invalidation point |
This price action matters because it tests whether current market structure can absorb selling pressure without breaking key technical levels. For institutions, a break below $92,500 could trigger systematic selling from quantitative funds that use moving average crossovers as entry/exit signals. For retail traders, the $94,000 level represents a psychological barrier that influences sentiment and trading behavior. The contradiction between neutral sentiment scores and price weakness suggests either market inefficiency or impending volatility expansion. According to on-chain data from Etherscan, Bitcoin's network activity shows increased transaction volume despite price declines, indicating fundamental strength beneath surface price action.
Market analysts on X/Twitter express divided views. Bulls point to the accumulation patterns and argue this is a healthy correction within an uptrend. One quantitative trader noted, "The Volume Profile shows absorption at $94k—this looks like accumulation, not distribution." Bears highlight the failure to hold $94,000 and warn of potential head-and-shoulders patterns forming on lower timeframes. The lack of consensus reflects the ambiguous data environment, with neither side possessing conclusive evidence for their thesis.
Bullish Case: If Bitcoin holds above $92,500 and reclaims $95,800, market structure suggests a move toward $98,500 resistance. This scenario requires sustained on-chain accumulation and positive gamma positioning in options markets. The implementation of EIP-4844 on Ethereum's testnet could create positive spillover effects for the broader crypto market.
Bearish Case: A daily close below $92,500 invalidates the bullish structure and opens the path to $89,000 support. This would confirm the current move as a distribution phase rather than accumulation. Market structure would then require a reassessment of the entire uptrend from the 2025 lows.
Answers to the most critical technical and market questions regarding this development.

Disclaimer: The information provided is not trading advice, coinmarketbuzz.com holds no liability for any investments made based on the information provided on this page. We strongly recommend independent research and/or consultation with a qualified professional before making any investment decisions.
coinmarketbuzz.com leverages advanced AI technology to analyze market data. All content is fact-checked and reviewed by our editorial team to ensure accuracy and neutrality.