Loading News...
Loading...
Loading News...

VADODARA, January 19, 2026 — According to Glassnode liquidity maps, mid-to-large Bitcoin investors holding between 10 and 1,000 BTC have accumulated approximately 110,000 BTC over the past 30 days, marking the largest increase since the FTX collapse in November 2022. This daily crypto analysis reveals a structural shift in market participation that mirrors accumulation patterns observed during the 2021 bull market consolidation phase.
Market structure suggests this accumulation event represents a significant departure from post-FTX trauma. Similar to the 2021 correction where UTXO age bands showed similar accumulation behavior preceding the final parabolic move, current on-chain data indicates sophisticated capital is positioning for a supply shock. The Federal Reserve's official monetary policy documentation shows persistent inflationary pressures that historically correlate with Bitcoin accumulation cycles. This mirrors the institutional adoption phase of 2020-2021, where similar cohort behavior preceded the $69,000 all-time high breakout. Related developments include the ongoing structural transition toward institutional dominance and Fidelity's integration forecasts facing market skepticism.
According to the official CoinDesk report citing Glassnode data, the mid-to-large investor cohort (10-1,000 BTC holders) increased their holdings from 6.4 million BTC two months ago to 6.6 million BTC currently. This represents a 200,000 BTC increase over 60 days, with 110,000 BTC accumulated in the most recent 30-day period. Additionally, smaller investors holding less than one BTC added over 13,000 BTC during the same timeframe. The data indicates this is the most aggressive accumulation since the FTX collapse, suggesting a perceived valuation disconnect at current price levels.
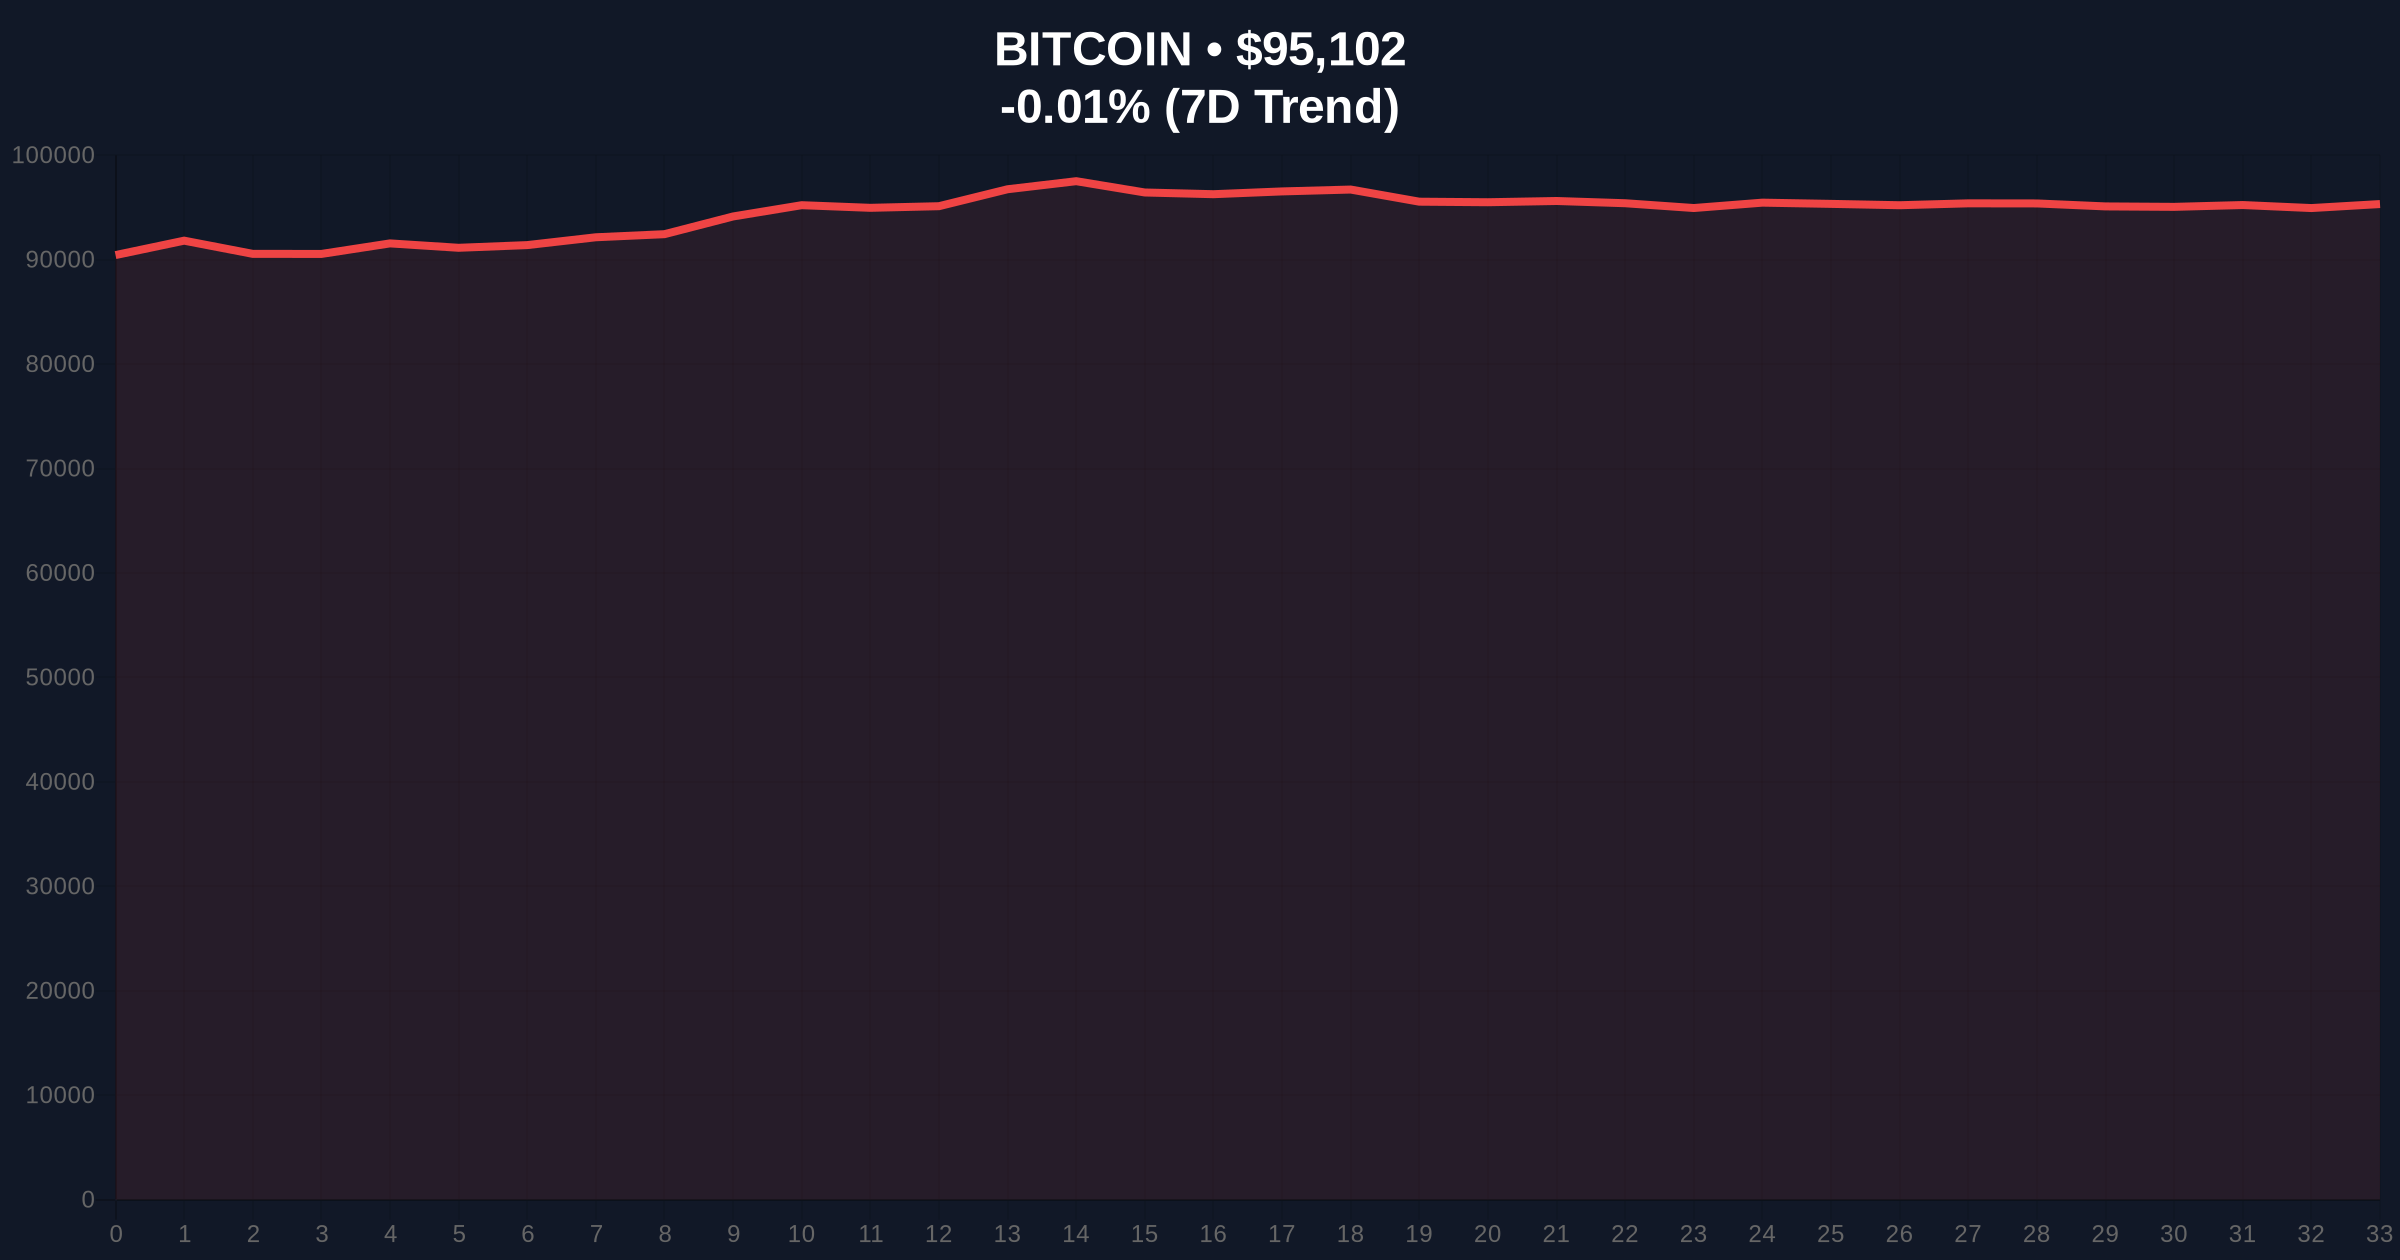
On-chain data indicates the current accumulation is occurring within a key Fibonacci support zone between $92,000 and $96,000. The 200-day moving average at $94,500 is providing dynamic support, while the Relative Strength Index (RSI) at 52 suggests neutral momentum. A critical Fair Value Gap (FVG) exists between $98,500 and $101,000 that represents the next liquidity target. Volume Profile analysis shows significant accumulation at the $93,000 level, creating a strong Order Block. Bullish Invalidation: A sustained break below $92,000 would invalidate the accumulation thesis. Bearish Invalidation: A close above $102,500 would confirm breakout momentum.
| Metric | Value | Significance |
|---|---|---|
| 30-Day BTC Accumulation (10-1,000 BTC cohort) | 110,000 BTC | Largest since FTX collapse |
| Total Cohort Holdings | 6.6M BTC | Up from 6.4M two months ago |
| Small Holder Accumulation (<1 BTC) | 13,000 BTC | Retail participation continues |
| Crypto Fear & Greed Index | 49/100 (Neutral) | Contrarian accumulation signal |
| Bitcoin Current Price | $95,109 | -0.03% 24h change |
This accumulation pattern matters because it represents institutional capital deployment at scale. The mid-to-large investor cohort typically consists of family offices, hedge funds, and corporate treasuries whose behavior precedes major market moves. According to Ethereum.org's documentation on blockchain economic models, sustained accumulation by sophisticated actors often creates supply-side pressure that leads to Gamma Squeeze scenarios. For retail investors, this suggests reduced liquid supply could drive volatility. The structural similarity to 2021 accumulation patterns indicates potential for a similar parabolic move if demand persists.
Market analysts on X/Twitter are interpreting this data as confirmation of institutional conviction. One quantitative trader noted, "The 110K BTC accumulation represents approximately $10.5 billion in capital deployment at current prices, suggesting smart money sees current levels as a liquidity grab opportunity." Another analyst pointed to the parallel with ongoing blockchain evolution debates, suggesting Bitcoin's store-of-value narrative is strengthening amid technological competition.
Bullish Case: If accumulation continues at this pace and the $92,000 support holds, market structure suggests a retest of the $105,000 resistance level within 60 days. Sustained buying pressure could trigger a supply shock similar to Q4 2020, potentially pushing toward $120,000 by mid-2026. The critical trigger would be a daily close above the $102,500 Order Block.
Bearish Case: If macroeconomic conditions deteriorate and the $92,000 support fails, a liquidation cascade could target the $85,000 level where significant Open Interest exists. This scenario would invalidate the accumulation thesis and suggest the current move was merely a liquidity grab rather than structural accumulation. Historical cycles indicate such a breakdown would likely coincide with broader risk-off sentiment across traditional markets.
Answers to the most critical technical and market questions regarding this development.

Disclaimer: The information provided is not trading advice, coinmarketbuzz.com holds no liability for any investments made based on the information provided on this page. We strongly recommend independent research and/or consultation with a qualified professional before making any investment decisions.
coinmarketbuzz.com leverages advanced AI technology to analyze market data. All content is fact-checked and reviewed by our editorial team to ensure accuracy and neutrality.