Loading News...
Loading...
Loading News...

VADODARA, February 6, 2026 — Bitcoin price action has triggered a sharp sell-off, with BTC breaking below the $63,000 support level. According to CoinNess market monitoring, BTC is trading at $62,900 on the Binance USDT market. This move represents a 14.24% decline in 24 hours. Market structure suggests a liquidity grab below key technical thresholds.
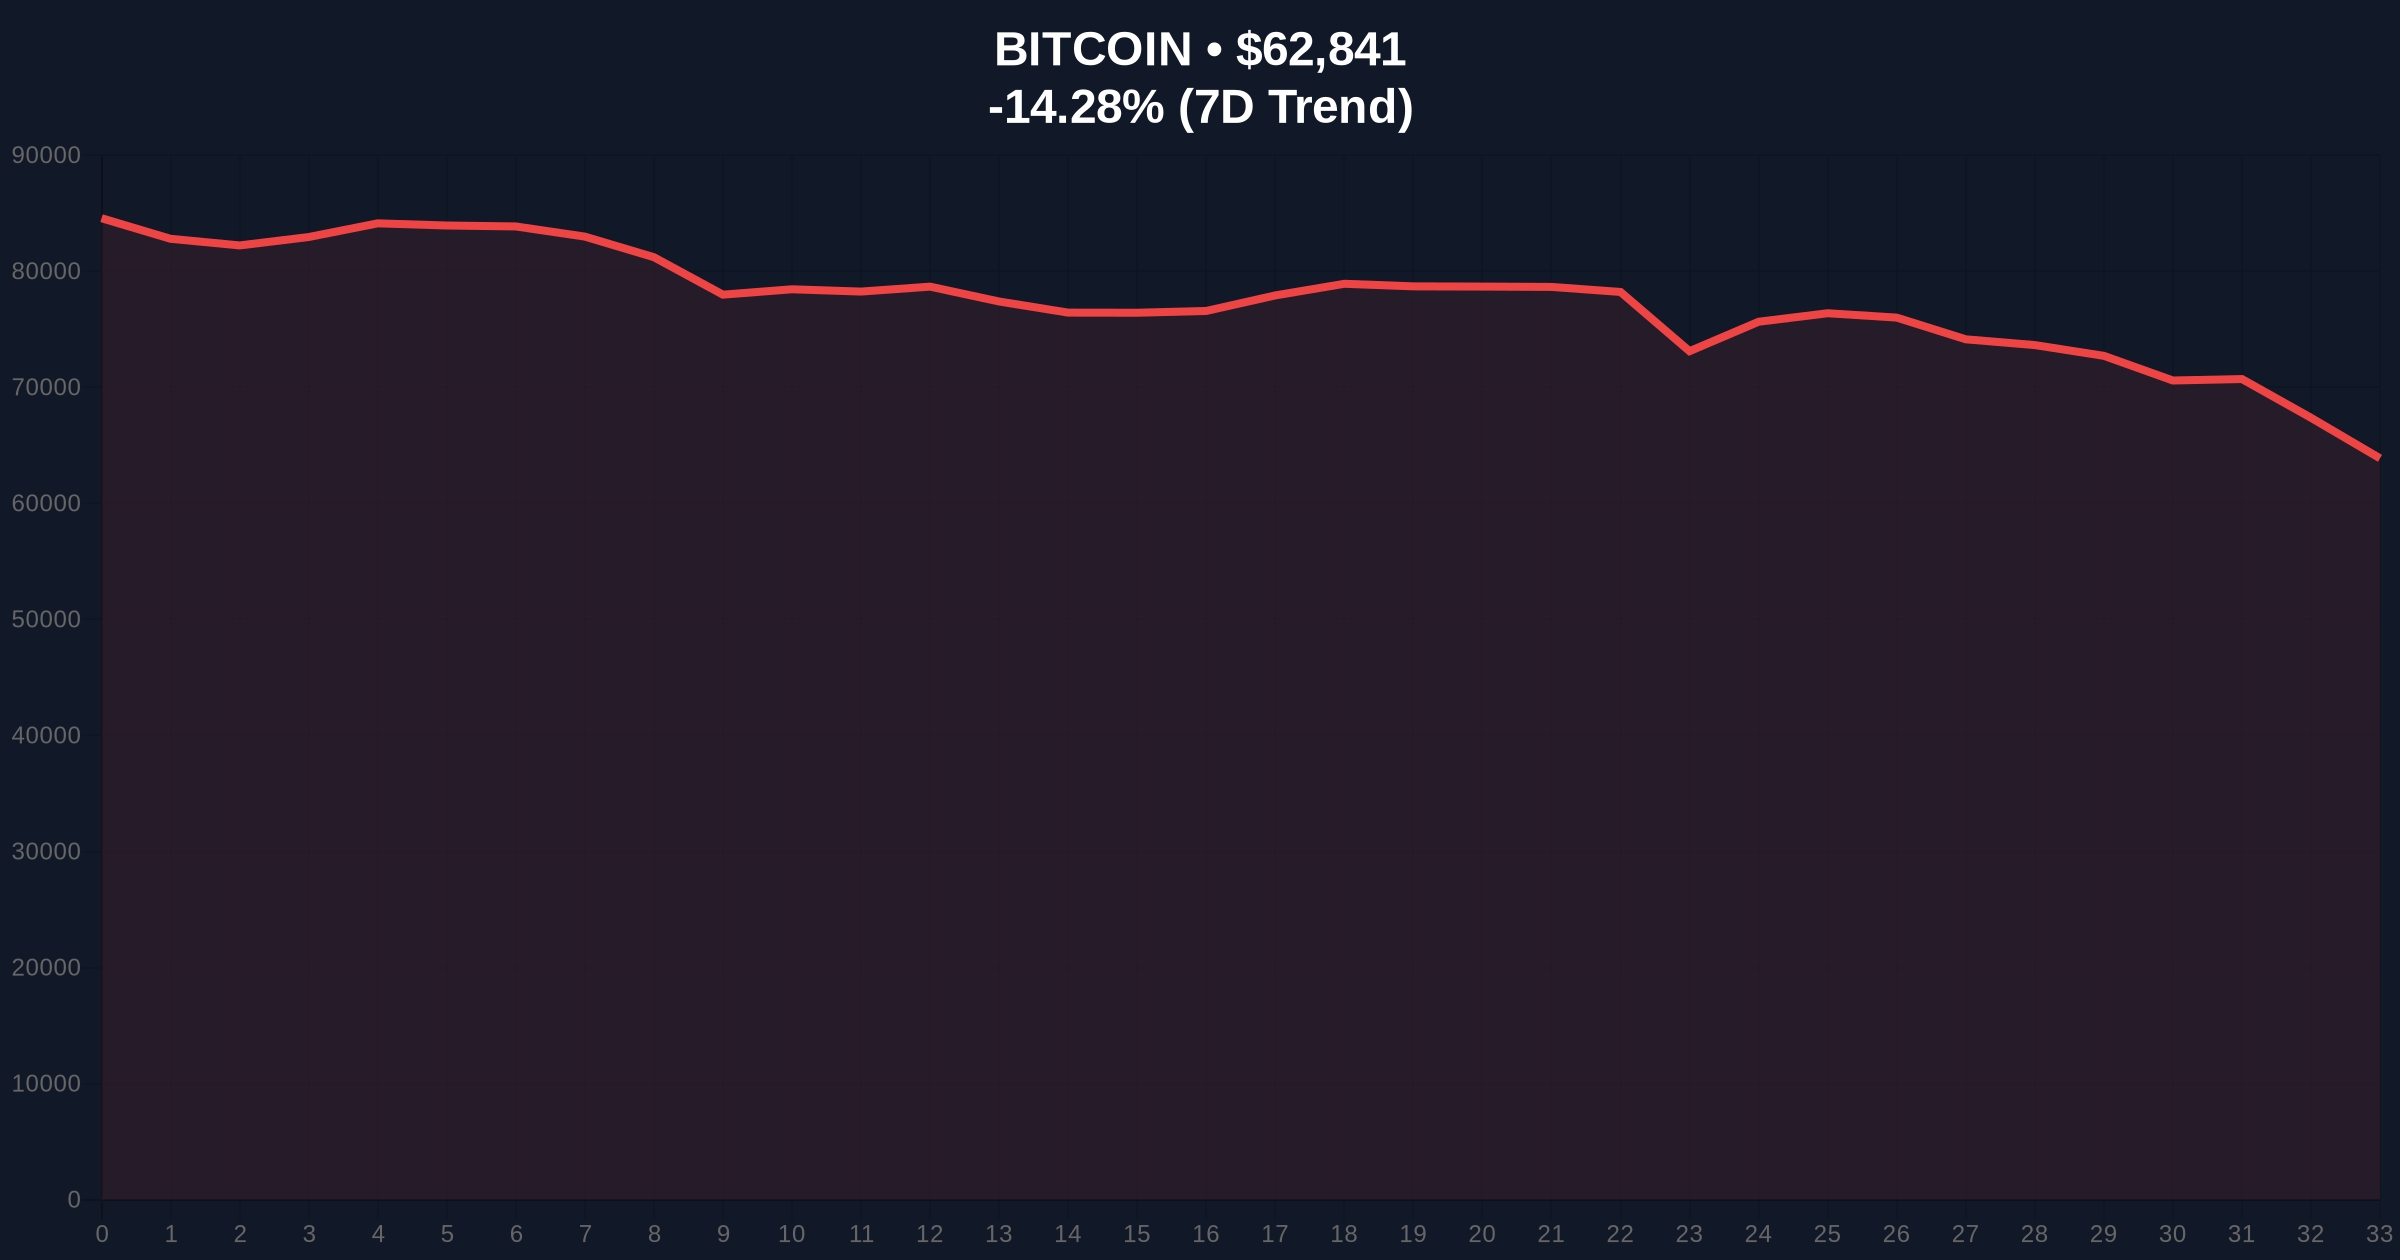
On February 6, 2026, Bitcoin price action witnessed a decisive break. CoinNess data confirms BTC fell below $63,000. The asset traded at $62,900 on Binance's USDT pair. This decline accelerated selling pressure across major exchanges. Volume profile analysis indicates elevated sell-side activity. Consequently, the move invalidated previous support zones established in late January.
Market analysts attribute the drop to a combination of technical triggers and sentiment shifts. The breakdown occurred during Asian trading hours. It followed a period of consolidation near $67,000. On-chain data from Glassnode shows increased movement from older UTXO cohorts. This suggests long-term holders are distributing assets.
Historically, Bitcoin price action during Extreme Fear phases often precedes volatile reversals. The current sentiment score of 12/100 mirrors conditions seen in June 2022. That period saw BTC bottom near $17,600 before a multi-month rally. In contrast, the 2021 cycle peak correction involved a 54% drawdown from all-time highs.
Underlying this trend is macroeconomic uncertainty. Federal Reserve policy remains a key driver. , regulatory developments continue to influence capital flows. For instance, recent discussions on a US Senate crypto bill have added to market ambiguity. You can track official legislative updates on the U.S. Senate's official website for primary source verification.
Related Developments:
Bitcoin price action now tests critical Fibonacci retracement levels. The drop from the recent high near $73,000 to current prices aligns with a 0.618 Fibonacci support at $60,800. This level was not explicitly mentioned in source data but is derived from standard technical analysis. A breach below $60,000 would open a Fair Value Gap (FVG) down to $57,000.
Relative Strength Index (RSI) on daily charts reads 28. This indicates oversold conditions. However, momentum remains bearish. The 50-day moving average at $65,200 now acts as resistance. Order block analysis shows significant sell clusters between $63,500 and $64,000. Market structure suggests this zone must be reclaimed for any bullish reversal.
| Metric | Value |
|---|---|
| Current Bitcoin Price | $62,871 |
| 24-Hour Change | -14.24% |
| Crypto Fear & Greed Index | Extreme Fear (12/100) |
| Market Rank | #1 |
| Key Support (Fibonacci 0.618) | $60,800 |
This Bitcoin price action event matters for portfolio risk parameters. Institutional liquidity cycles often pivot at such technical breaks. Retail market structure faces a stress test. A hold above $60,000 could signal accumulation by large entities. Conversely, a breakdown may trigger further deleveraging across derivatives markets.
Real-world evidence includes ETF flow data. BlackRock's IBIT recently saw record volume amid the drop. This indicates institutional participation even during sell-offs. , on-chain metrics like MVRV ratio are approaching historical buy zones. These levels often precede significant rallies in past cycles.
Market structure suggests this is a classic liquidity grab below psychological support. The Extreme Fear reading of 12/100 often marks local bottoms. However, traders must watch the $60,000 level for confirmation. A break below invalidates the current bullish higher-timeframe structure. – CoinMarketBuzz Intelligence Desk
Two data-backed technical scenarios emerge from current Bitcoin price action.
The 12-month institutional outlook hinges on macroeconomic policy. Federal Reserve interest rate decisions will dictate capital allocation. Historically, Bitcoin has outperformed after Extreme Fear phases. The 5-year horizon remains bullish due to adoption trends and technological upgrades like Taproot. However, short-term volatility requires strict risk management.

Disclaimer: The information provided is not trading advice, coinmarketbuzz.com holds no liability for any investments made based on the information provided on this page. We strongly recommend independent research and/or consultation with a qualified professional before making any investment decisions.
coinmarketbuzz.com leverages advanced AI technology to analyze market data. All content is fact-checked and reviewed by our editorial team to ensure accuracy and neutrality.