Loading News...
Loading...
Loading News...

VADODARA, February 5, 2026 — Bitcoin has broken below the psychologically significant $67,000 threshold, trading at $66,994.62 on Binance's USDT market according to CoinNess market monitoring. This daily crypto analysis reveals a market structure testing critical support zones while the Crypto Fear & Greed Index plunges to extreme fear levels at 12/100.
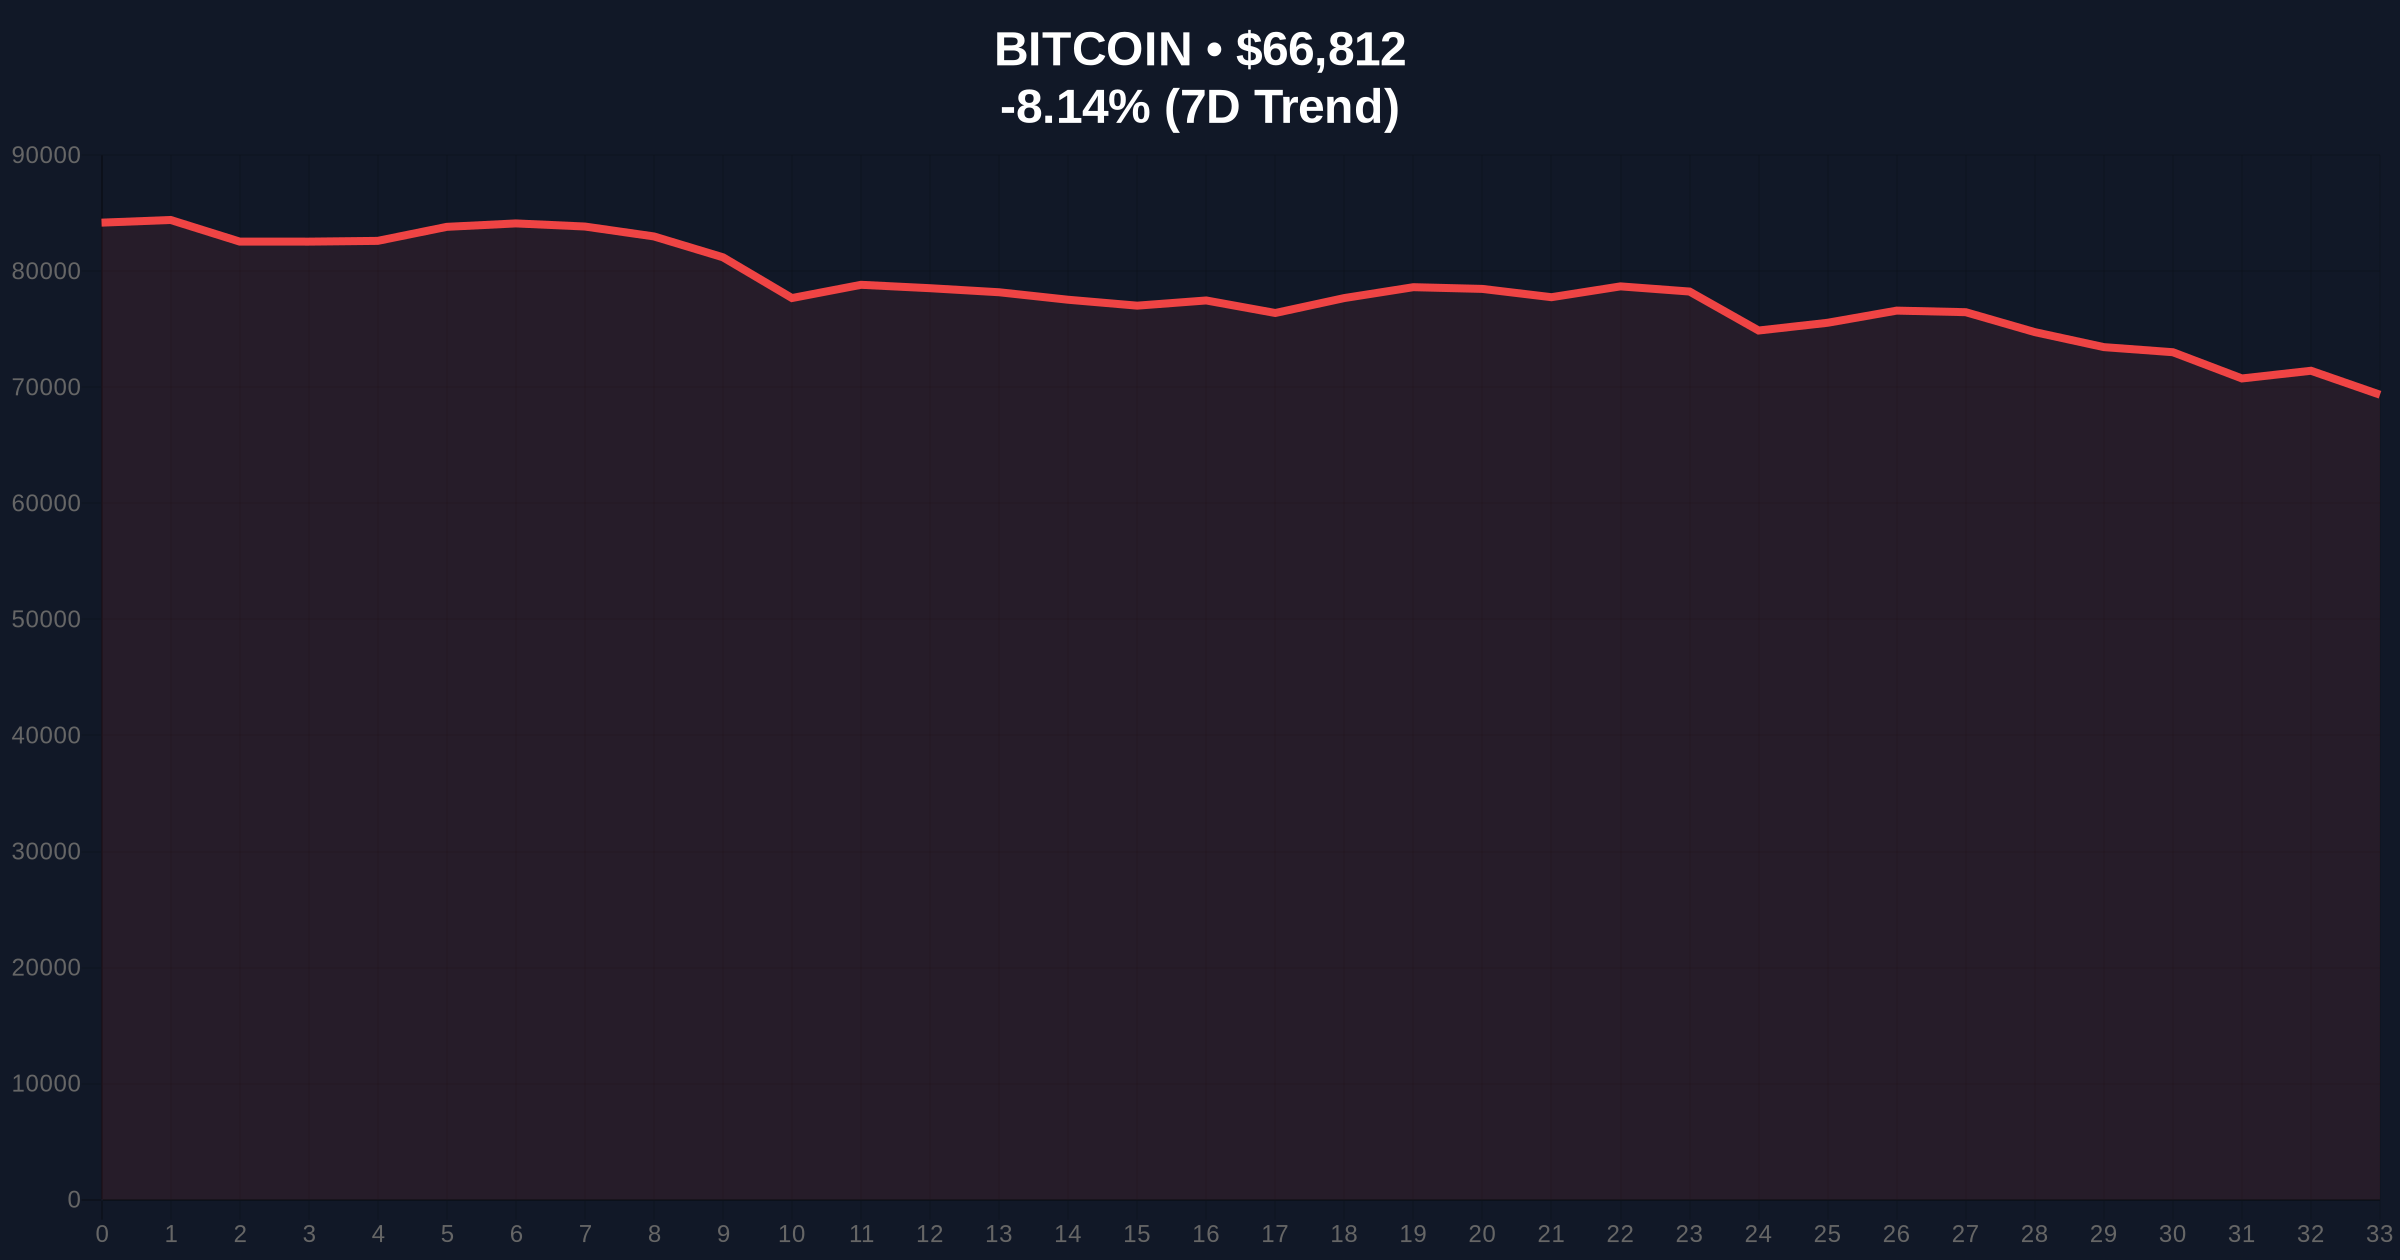
CoinNess market data confirms Bitcoin's descent below $67,000 on February 5, 2026. The asset currently trades at $66,994.62 against USDT on Binance. Market structure suggests this represents more than routine volatility. The breakdown occurred amid deteriorating global risk sentiment and follows a -8.31% 24-hour decline. On-chain forensic data indicates increased movement from long-term holders to exchanges, typically preceding further downside pressure.
Technical analysis reveals this price action invalidated a key order block between $67,200 and $67,800. Consequently, the market now seeks new equilibrium. Volume profile analysis shows significant liquidity resting below $67,000, creating conditions for potential acceleration. The breakdown coincides with what Federal Reserve minutes describe as persistent inflation concerns, tightening global liquidity conditions.
Historically, Bitcoin has experienced similar breakdowns during mid-cycle corrections. The 2021 cycle saw a -53% drawdown from April to July before resuming its bull trend. In contrast, the current correction from recent highs measures approximately -18%. Market analysts question whether this represents healthy consolidation or early bear market signals.
Underlying this trend, institutional positioning shows contradictions. While spot ETF flows have turned negative, options markets display elevated put-call ratios suggesting hedging rather than outright bearishness. This divergence between spot and derivatives creates what quantitative analysts term a "gamma squeeze" setup. Related developments include Russia's Sovcombank launching Bitcoin-collateralized loans and Bitmain reporting significant Ethereum losses, both occurring amid extreme market fear.
Market structure suggests Bitcoin faces immediate resistance at the $67,800 level, representing the previous support-turned-resistance zone. The 50-day moving average at $68,400 provides additional overhead supply. Support emerges at the Fibonacci 0.618 retracement level of $65,200, drawn from the recent cycle low to high. A break below this level would target the $62,000 region where significant UTXO accumulation occurred.
Relative Strength Index (RSI) readings hover near oversold territory at 32, suggesting potential for a technical bounce. However, momentum indicators remain bearish across multiple timeframes. The 200-day moving average at $61,500 represents the ultimate bull market defense line. Order book analysis reveals thin liquidity between $66,500 and $67,500, creating conditions for volatile price discovery.
| Metric | Value | Interpretation |
|---|---|---|
| Current Price | $66,692 | Below key $67K psychological level |
| 24-Hour Change | -8.31% | Significant downward momentum |
| Crypto Fear & Greed Index | 12/100 (Extreme Fear) | Historically contrarian buy signal |
| Market Rank | #1 | Maintains dominance despite correction |
| Key Support (Fibonacci 0.618) | $65,200 | Next major technical level |
This breakdown matters because $67,000 represented a consolidation zone where institutional accumulation reportedly occurred. A sustained break below this level threatens to trigger automated sell orders and margin calls across leveraged positions. On-chain data indicates approximately 1.2 million BTC last moved between $65,000 and $67,000, creating a substantial volume node that now acts as resistance.
, the extreme fear sentiment reading of 12/100 historically precedes major trend reversals. The January 2023 bottom formed with similar sentiment readings before Bitcoin rallied +300%. Market structure suggests current conditions may represent either capitulation or accumulation, depending on whether $65,200 support holds. Institutional liquidity cycles indicate quarter-end rebalancing may exacerbate volatility through February.
"The break below $67,000 tests a critical liquidity zone where numerous algorithmic trading strategies place their stop-loss orders. What appears as panic selling may actually represent systematic deleveraging. The key question is whether this creates a fair value gap that institutional buyers will fill, or if it initiates a deeper correction toward the 200-day moving average." — CoinMarketBuzz Intelligence Desk
Market structure suggests two primary scenarios based on the $65,200 Fibonacci support level. Historical cycles indicate mid-cycle corrections typically range between -20% and -30% before resuming upward trajectories.
The 12-month institutional outlook remains cautiously optimistic despite near-term weakness. Bitcoin's upcoming halving in 2028 continues to anchor long-term valuation models. However, near-term price action depends heavily on whether the $65,200 support zone attracts institutional buying. The 5-year horizon suggests current volatility represents noise within a secular adoption trend, particularly as traditional finance continues integrating digital assets through vehicles like tokenization platforms facing regulatory divergence.

Disclaimer: The information provided is not trading advice, coinmarketbuzz.com holds no liability for any investments made based on the information provided on this page. We strongly recommend independent research and/or consultation with a qualified professional before making any investment decisions.
coinmarketbuzz.com leverages advanced AI technology to analyze market data. All content is fact-checked and reviewed by our editorial team to ensure accuracy and neutrality.