Loading News...
Loading...
Loading News...

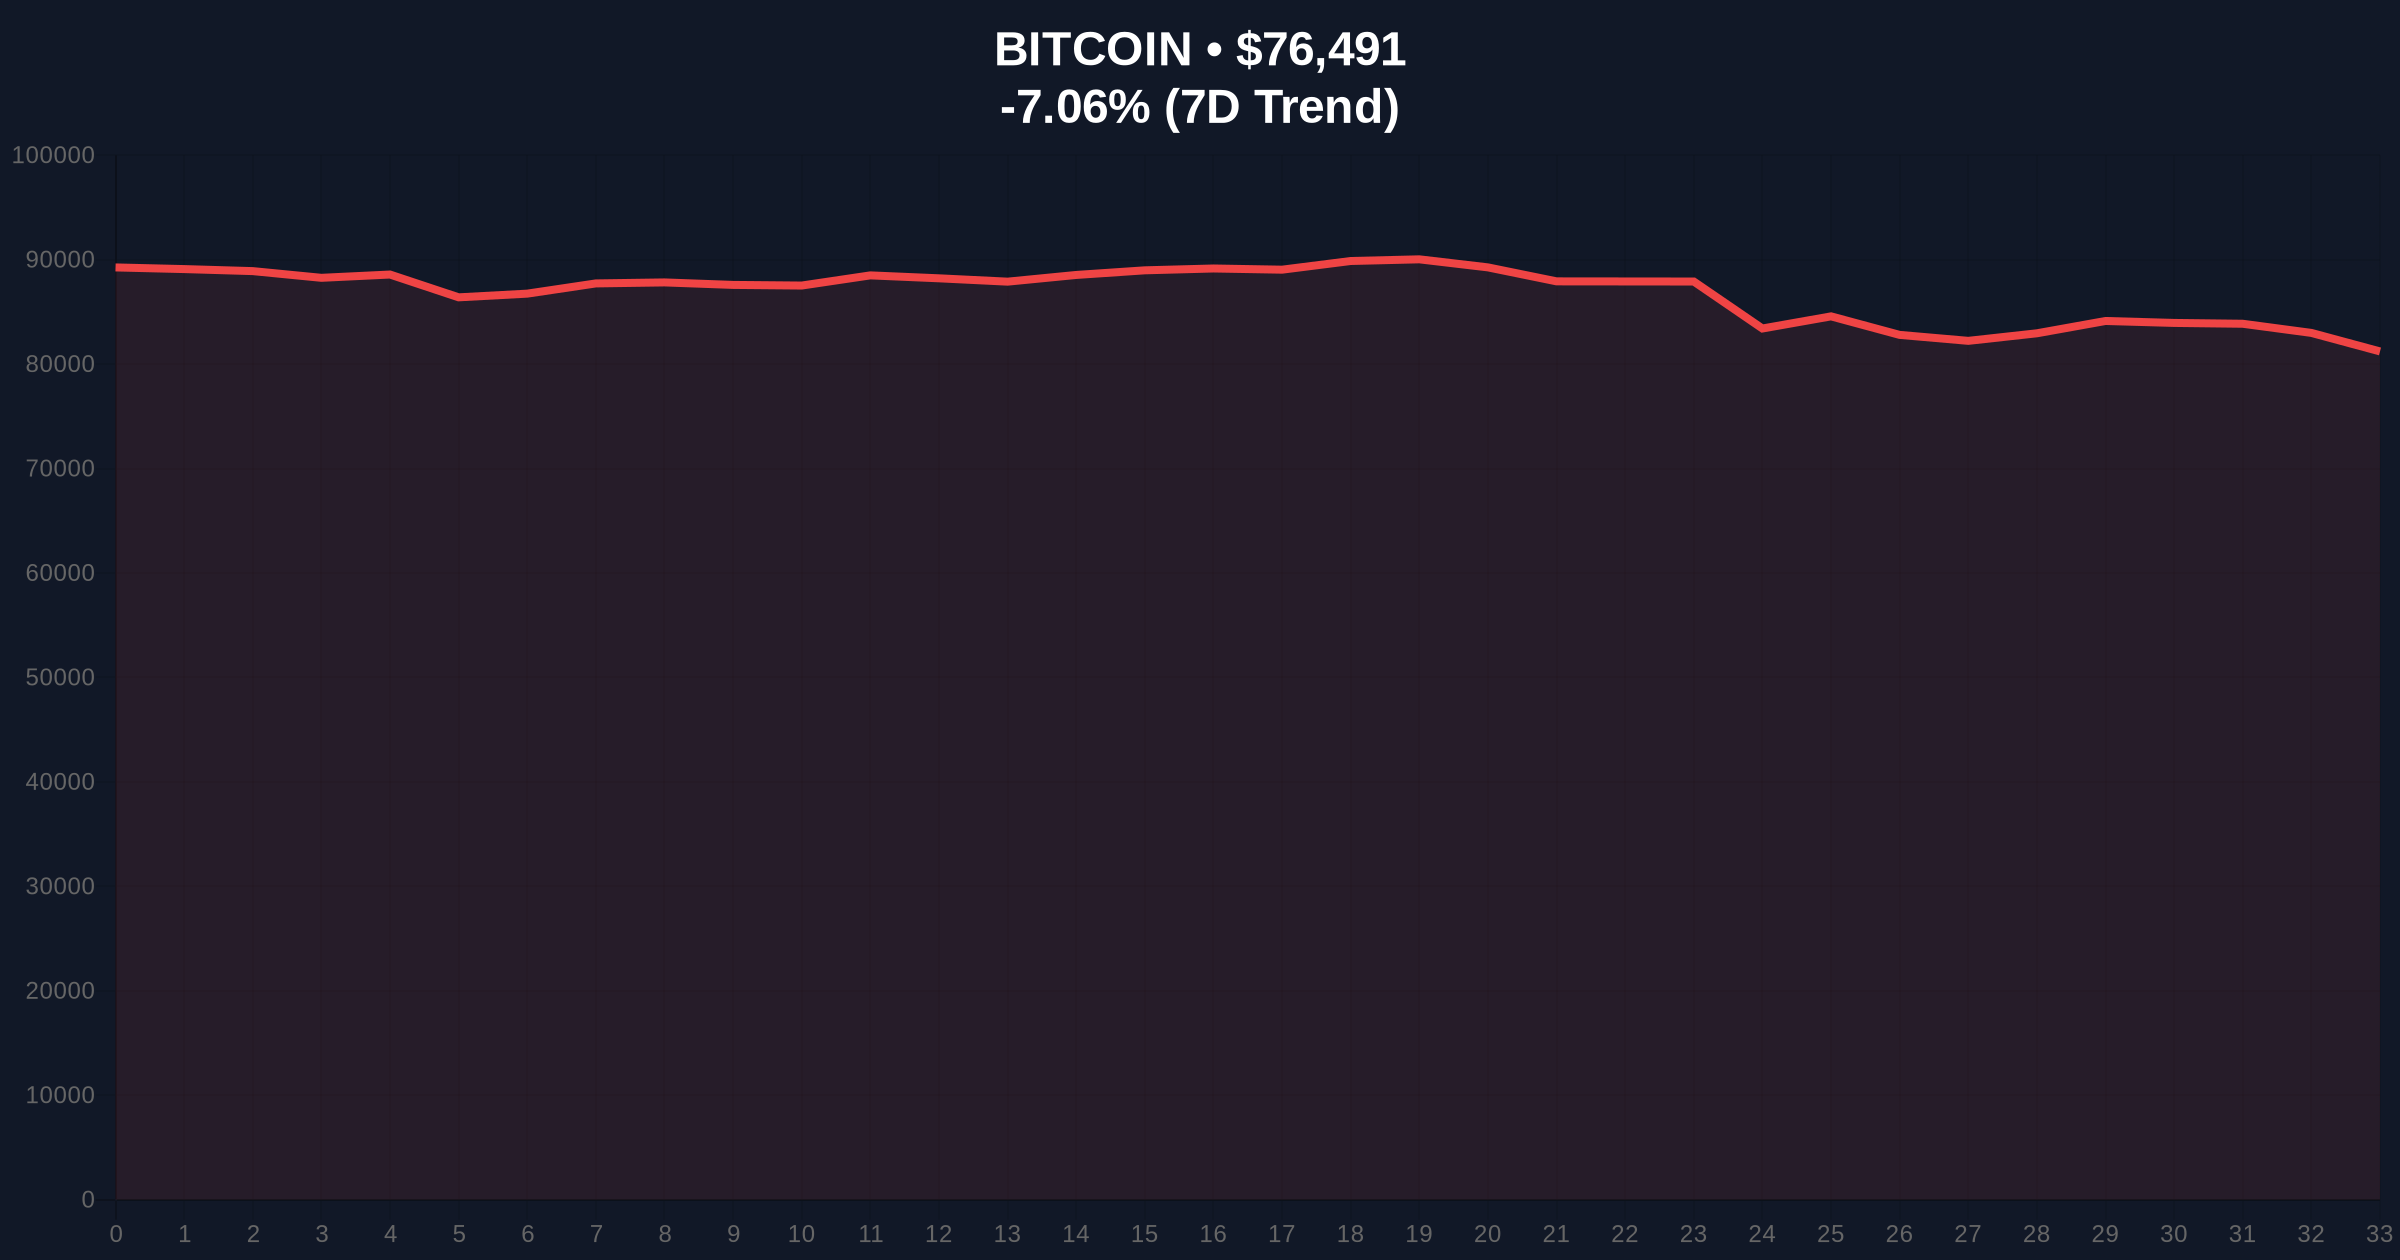
VADODARA, January 31, 2026 — Bitcoin price action shows a decisive breakdown below the $77,000 psychological support level, according to CoinNess market monitoring data. BTC currently trades at $76,959.56 on the Binance USDT market, marking a -6.20% decline over the past 24 hours. This move occurs as the Crypto Fear & Greed Index registers "Extreme Fear" at 20/100, suggesting potential capitulation events are unfolding across derivative markets.
CoinNess market monitoring confirms Bitcoin breached the $77,000 threshold during Asian trading hours. The breakdown represents more than a simple price movement. Market structure suggests this level previously functioned as a high-volume node in the Volume Profile. Consequently, its failure creates a significant Fair Value Gap (FVG) between $77,000 and $78,500. This FVG now acts as immediate resistance for any bullish recovery attempts.
According to on-chain data from Glassnode, the $77,000 zone corresponded with substantial UTXO accumulation from mid-2025. The breakdown invalidates these positions, potentially triggering stop-loss orders and margin calls. , exchange netflow metrics indicate moderate outflows from centralized exchanges, suggesting some holders are moving to cold storage despite the price decline.
Historically, Bitcoin has experienced similar support breakdowns during previous market cycles. The 2021 cycle saw multiple tests of the 50-week moving average before eventual recovery. In contrast, the current decline occurs amid different macroeconomic conditions, including potential Federal Reserve policy shifts documented in recent Federal Reserve communications.
Underlying this trend, the "Extreme Fear" sentiment reading at 20/100 often precedes local bottoms. However, market analysts caution that sentiment alone doesn't guarantee reversal. The 2018 bear market maintained extreme fear readings for extended periods before finding a durable bottom. Current price action mirrors early-stage distribution patterns observed in previous cycle transitions.
Related developments in derivative markets provide additional context:
Technical analysis reveals critical levels beyond those mentioned in primary sources. The $75,200 level represents the Fibonacci 0.618 retracement from the 2025 cycle low to the recent all-time high. This confluence zone includes the 200-day moving average, creating a potent support cluster. A breakdown below this level would target the $72,500 region, corresponding with the 0.786 Fibonacci extension.
Market structure suggests the current decline exhibits characteristics of a liquidity grab. Bears are likely targeting the dense bid liquidity below $77,000 before potential reversal. The Relative Strength Index (RSI) on daily timeframes approaches oversold territory at 32, but hasn't reached extreme levels that typically signal exhaustion. Volume analysis shows increasing selling pressure on breakdowns, confirming bearish conviction.
Order block analysis identifies a significant bearish order block between $78,800 and $79,500. This zone now acts as primary resistance for any recovery attempts. The inability to reclaim this order block would confirm continued bearish dominance. Conversely, a reclaim above $79,500 would invalidate the current breakdown structure.
| Metric | Value |
|---|---|
| Current Bitcoin Price | $77,193 |
| 24-Hour Change | -6.20% |
| Market Rank | #1 |
| Crypto Fear & Greed Index | Extreme Fear (20/100) |
| Critical Support Level | $75,200 (Fibonacci 0.618) |
This breakdown matters for institutional portfolio management. The $77,000 level represented a key psychological and technical threshold for many algorithmic trading systems. Its failure triggers systematic selling across quantitative funds. , the extreme fear sentiment creates potential gamma squeeze conditions in options markets, particularly for puts expiring near current price levels.
Market structure suggests retail traders face increasing margin pressure. The liquidation of leveraged long positions fuels further downside momentum. However, institutional accumulation often accelerates during such fear-driven selloffs. On-chain data indicates smart money addresses have been gradually increasing Bitcoin holdings throughout the decline, suggesting a divergence between price action and accumulation patterns.
"The $77,000 breakdown represents a critical technical failure that demands respect. Market participants should monitor the $75,200 Fibonacci confluence zone closely. A hold above this level maintains the broader bullish structure, while a breakdown would signal deeper correction potential. Extreme fear readings typically precede volatility compression before directional resolution." — CoinMarketBuzz Intelligence Desk
Two primary technical scenarios emerge from current market structure:
The 12-month institutional outlook remains cautiously optimistic despite short-term weakness. Historical cycles suggest that corrections of 20-30% during bull markets create entry opportunities for long-term capital. The 5-year horizon continues to favor Bitcoin as digital gold, particularly amid evolving monetary policy landscapes. However, traders must navigate current volatility with disciplined risk management.

Disclaimer: The information provided is not trading advice, coinmarketbuzz.com holds no liability for any investments made based on the information provided on this page. We strongly recommend independent research and/or consultation with a qualified professional before making any investment decisions.
coinmarketbuzz.com leverages advanced AI technology to analyze market data. All content is fact-checked and reviewed by our editorial team to ensure accuracy and neutrality.


