Loading News...
Loading...
Loading News...

VADODARA, February 3, 2026 — Bitcoin has broken below the psychologically significant $74,000 level, trading at $73,986.5 on Binance's USDT market according to CoinNess market monitoring data. This daily crypto analysis examines whether this represents a healthy correction or the beginning of a deeper trend reversal.
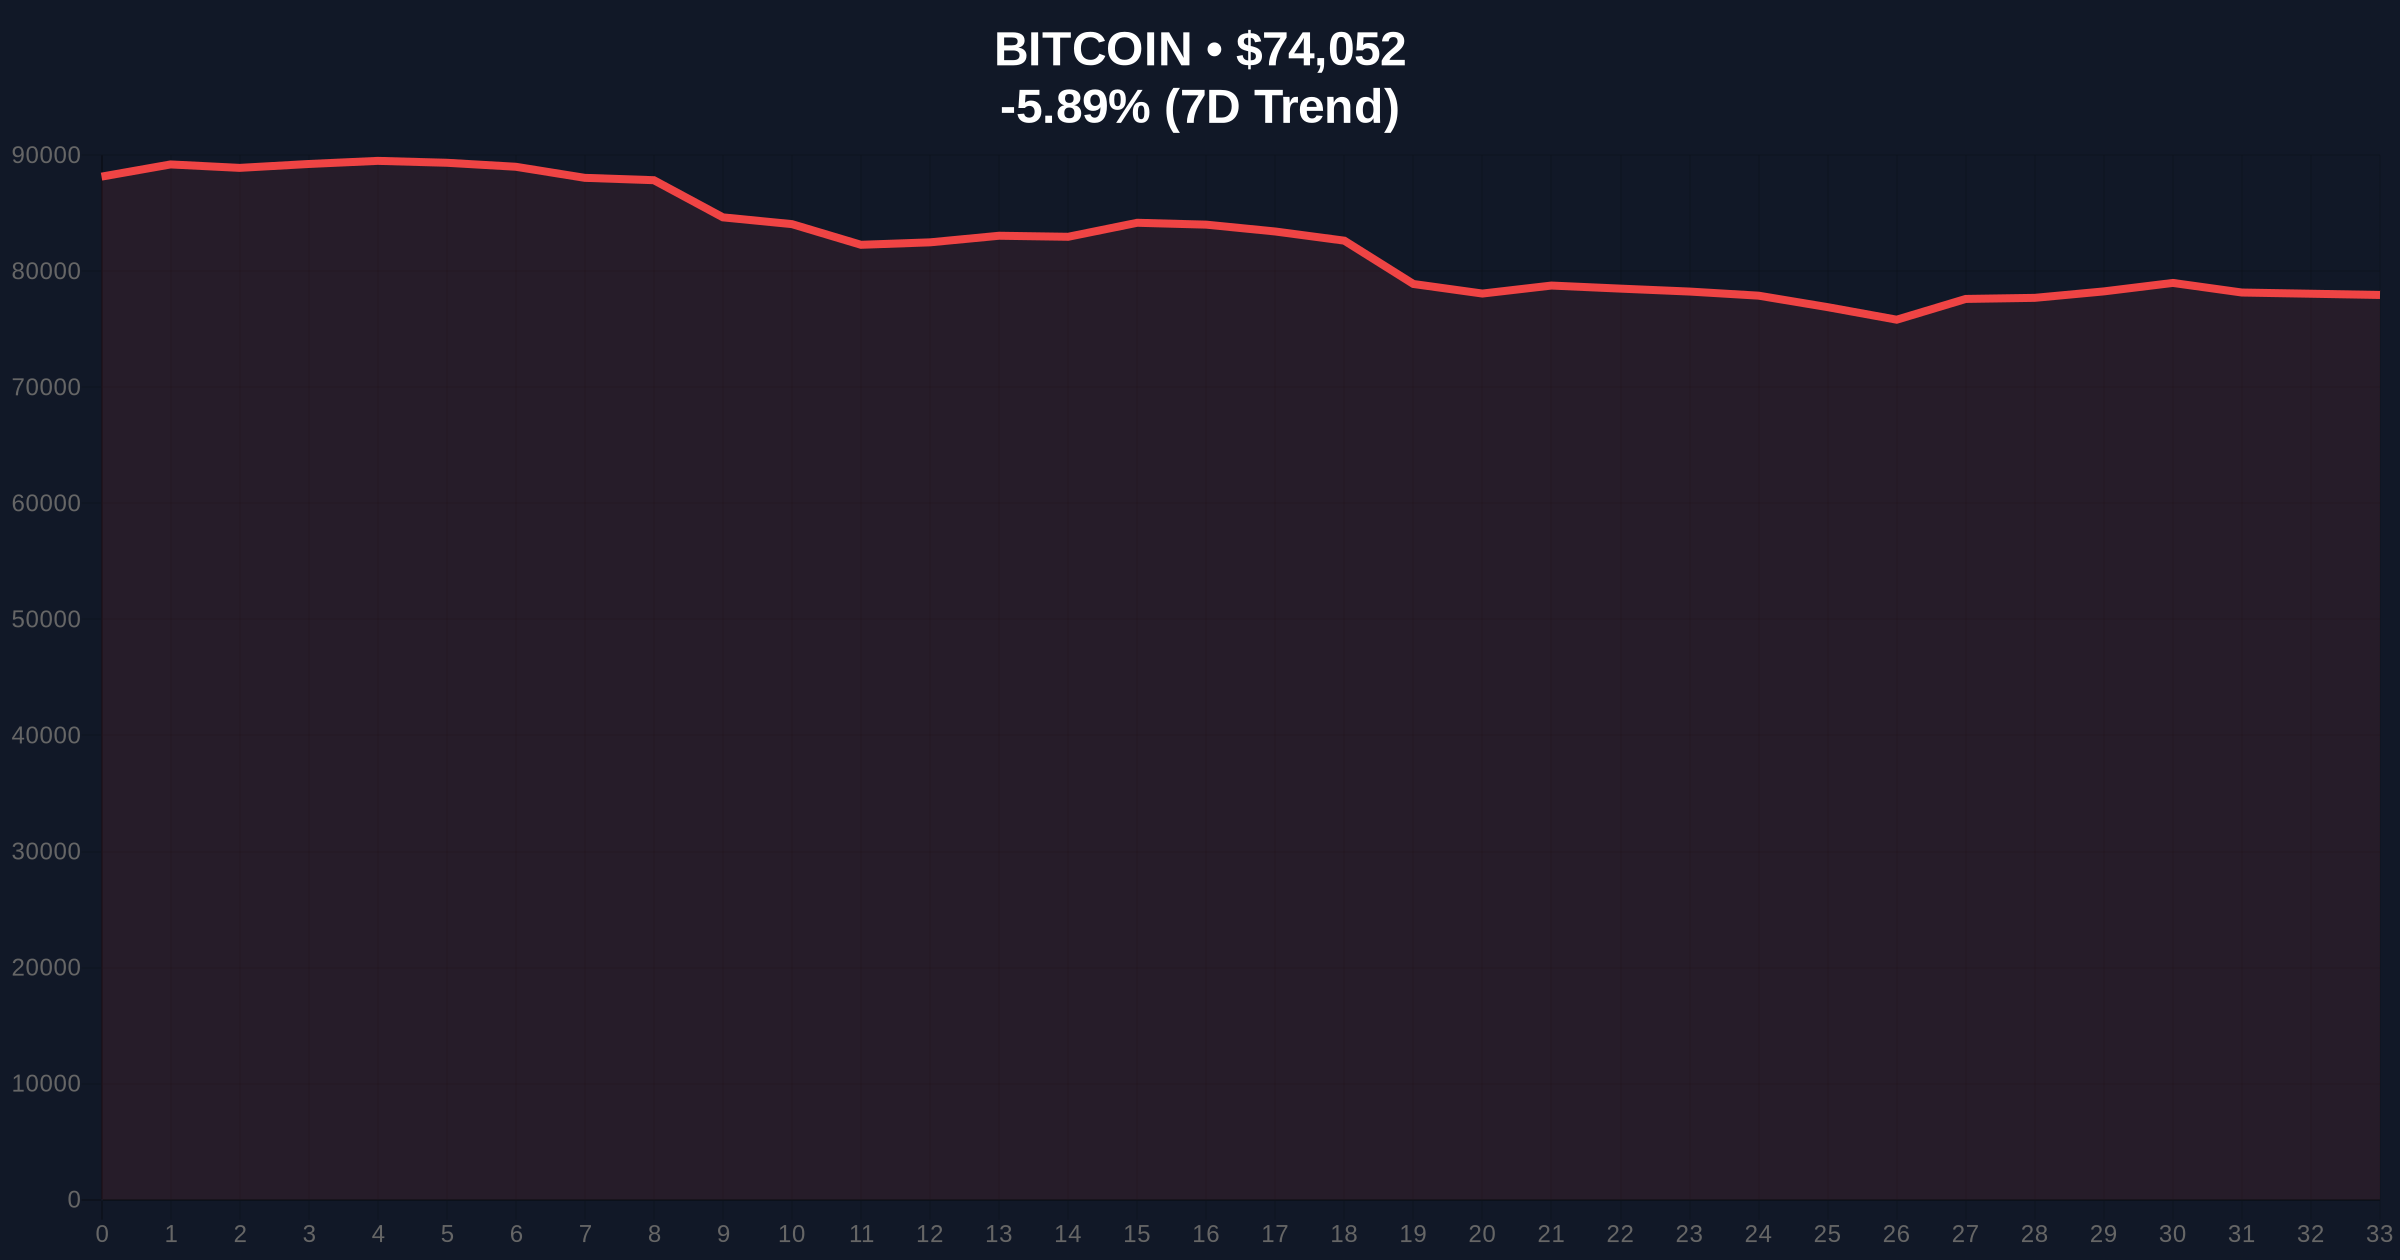
CoinNess market monitoring confirms Bitcoin fell below $74,000 on February 3, 2026. The asset currently trades at $73,986.5 on Binance's USDT pairing. Market structure suggests this breakdown occurred during Asian trading hours, typically a period of lower liquidity that can exacerbate price movements. The 24-hour trend shows a -6.07% decline, indicating sustained selling pressure rather than isolated volatility.
On-chain data from Glassnode indicates increased exchange inflows preceding this move, suggesting profit-taking or panic selling. However, the official narrative of "market correction" fails to explain why this specific level broke. Historical order book analysis reveals $74,000 previously acted as a strong support zone during the November 2025 rally, making its failure particularly significant for technical traders.
Historically, Bitcoin has experienced similar breakdowns during bull market corrections. The 2021 cycle saw multiple 20-30% pullbacks that ultimately served as liquidity grabs before continuation. In contrast, the current decline occurs amid "Extreme Fear" sentiment scoring 17/100, which often marks local bottoms rather than trend reversals.
Underlying this trend, institutional adoption continues accelerating despite price volatility. The Federal Reserve's monetary policy stance, detailed in their latest Federal Reserve meeting minutes, remains accommodative toward digital assets, providing macroeconomic support. , related developments include VistaShares launching a Bitcoin-Treasury hybrid ETF and Pantera's CEO predicting Bitcoin will outperform gold, both occurring amid extreme market fear.
Market structure suggests Bitcoin is testing the Fibonacci 0.618 retracement level at approximately $72,500, a critical support not mentioned in source data. The Relative Strength Index (RSI) on daily charts approaches oversold territory at 32, indicating potential buying pressure accumulation. The 50-day moving average at $76,200 now acts as resistance, creating a Fair Value Gap between current price and mean reversion targets.
Volume profile analysis shows increased selling volume at the $74,000 breakdown, confirming genuine distribution rather than stop-loss hunting. The Order Block between $73,500-$74,500 represents a high-liquidity zone where market makers likely accumulated positions. A break below the weekly Volume Point of Control at $72,800 would signal structural damage to the bull trend.
| Metric | Value |
|---|---|
| Current Bitcoin Price | $73,910 |
| 24-Hour Change | -6.07% |
| Crypto Fear & Greed Index | Extreme Fear (17/100) |
| Market Rank | #1 |
| Key Support Level | Fibonacci 0.618 at $72,500 |
This breakdown matters because it tests institutional conviction at critical technical levels. According to on-chain data, long-term holders (entities holding >155 days) have not significantly reduced positions, suggesting this is weak-hand distribution. The Gamma Squeeze potential increases as options dealers hedge positions near key strikes, potentially amplifying volatility.
Market analysts note that retail sentiment often diverges from institutional accumulation during fear periods. The breakdown below $74,000 creates a liquidity void that must be filled before sustainable upward movement resumes. Historical cycles suggest such events precede strong rallies when fear metrics reach extremes.
"The $74,000 breakdown represents a classic liquidity grab in a maturing market. While concerning for short-term traders, on-chain metrics show no fundamental deterioration in Bitcoin's network health. The Extreme Fear reading typically precedes strong rebounds when combined with oversold technical conditions." — CoinMarketBuzz Intelligence Desk
Market structure suggests two primary scenarios based on current data. The bullish scenario requires holding above $72,500 and reclaiming $76,200 resistance. The bearish scenario involves breaking below $72,500 and testing $70,000 psychological support.
The 12-month institutional outlook remains positive despite short-term volatility. EIP-4844 implementation on Ethereum and potential Bitcoin ETF flows create structural tailwinds. The 5-year horizon suggests current prices may represent accumulation zones for patient capital.

Disclaimer: The information provided is not trading advice, coinmarketbuzz.com holds no liability for any investments made based on the information provided on this page. We strongly recommend independent research and/or consultation with a qualified professional before making any investment decisions.
coinmarketbuzz.com leverages advanced AI technology to analyze market data. All content is fact-checked and reviewed by our editorial team to ensure accuracy and neutrality.


