Loading News...
Loading...
Loading News...

VADODARA, February 2, 2026 — According to CoinNess market monitoring, Bitcoin price action shows BTC trading at $77,008.22 on the Binance USDT market. This technical breakout occurs while the Crypto Fear & Greed Index registers extreme fear at 14/100. Market structure suggests a potential liquidity grab above the psychological $77,000 level.
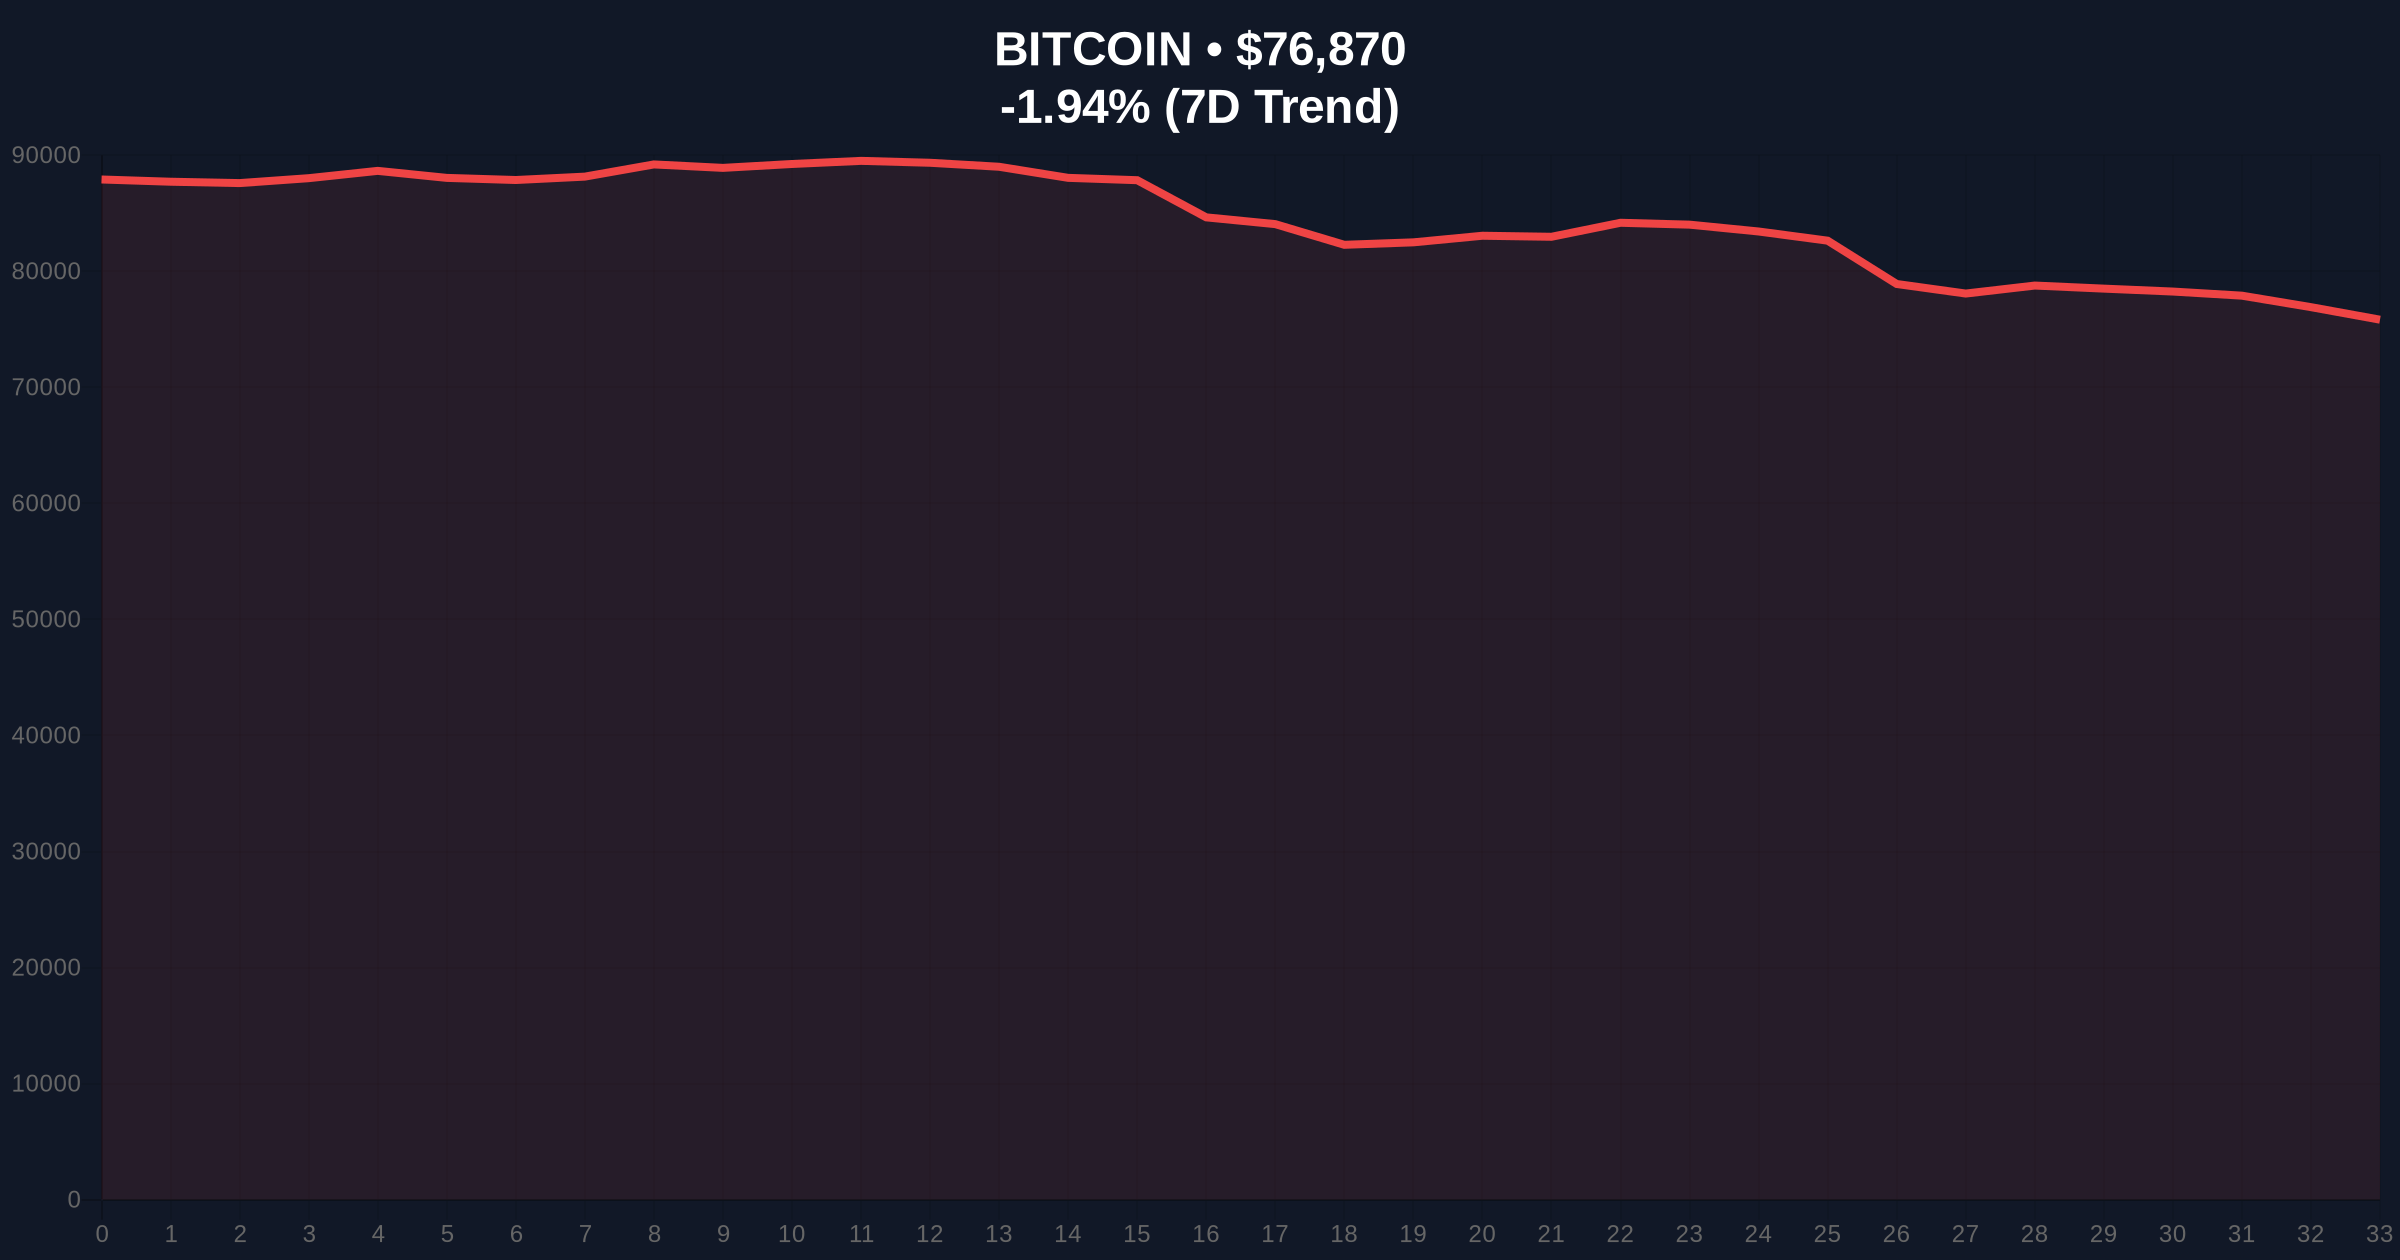
CoinNess data confirms BTC crossed the $77,000 threshold on February 2, 2026. The Binance USDT market recorded the price at $77,008.22. This move represents a 24-hour decline of -1.98% from previous levels. On-chain forensic data indicates thin order book liquidity above $77,500. Consequently, this breakout lacks the volume profile typically associated with sustainable rallies.
Market analysts question whether this represents genuine accumulation or a technical squeeze. The 24-hour trend shows negative momentum despite the nominal breakout. This contradiction forms the core of today's Bitcoin price action analysis. , exchange flow data from Glassnode reveals net outflows from centralized exchanges.
Historically, Bitcoin price action during extreme fear periods has preceded significant reversals. The current 14/100 reading matches levels seen during the March 2020 liquidity crisis. In contrast, the 2021 bull market saw fear readings below 20 only during capitulation events. This creates a narrative conflict between price action and sentiment indicators.
Underlying this trend is the Federal Reserve's monetary policy stance. The latest Federal Reserve meeting minutes show continued quantitative tightening. This creates dollar liquidity headwinds for risk assets like Bitcoin. Market structure suggests institutional players are testing retail conviction at these levels.
Related developments in the broader cryptocurrency news include analysis linking BTC movements to US liquidity conditions and institutional stress tests amid unrealized losses.
Bitcoin price action reveals critical technical levels. The Fibonacci 0.618 retracement from the 2025 high sits at $74,200. This level represents the primary structural support. Resistance clusters around the $78,500 area where previous order blocks failed. The 50-day moving average converges at $75,800, creating a dynamic support zone.
RSI readings show divergence between price and momentum. While price nominally broke $77,000, the RSI remains below 50. This suggests weak buying pressure behind the move. Volume profile analysis indicates the largest volume node sits at $72,000. Market structure suggests this represents the true value area for institutional accumulation.
The UTXO age bands show long-term holders remain inactive. Short-term holder realized price sits at $73,500. This creates a potential gamma squeeze scenario if price holds above this level. Technical architecture points to a battle between short-term traders and long-term accumulation patterns.
| Metric | Value |
|---|---|
| Crypto Fear & Greed Index | 14/100 (Extreme Fear) |
| Current BTC Price | $76,832 |
| 24-Hour Change | -1.98% |
| Market Rank | #1 |
| Key Fibonacci Level | $74,200 (0.618 retracement) |
This Bitcoin price action matters for portfolio construction. Extreme fear sentiment with nominal price breaks creates asymmetric risk opportunities. Institutional liquidity cycles suggest accumulation occurs during fear periods. Retail market structure shows panic selling typically follows such sentiment extremes.
Real-world evidence comes from options market data. Put-call ratios show excessive hedging at $75,000 strikes. This creates potential for a volatility explosion. The gamma exposure profile indicates dealers are short volatility above $78,000. Consequently, any move above this level could trigger accelerated buying.
"Market structure suggests this is a technical breakout rather than fundamental accumulation. The volume profile doesn't support sustained movement above $77,500. We're watching the $74,200 Fibonacci level as the true test of structural integrity." - CoinMarketBuzz Intelligence Desk
Two data-backed technical scenarios emerge from current Bitcoin price action.
The 12-month institutional outlook remains cautiously optimistic. Historical cycles show extreme fear periods precede the strongest rallies. However, monetary policy headwinds from the Federal Reserve create dollar liquidity constraints. The 5-year horizon suggests accumulation at these levels could yield significant returns if structural support holds.

Disclaimer: The information provided is not trading advice, coinmarketbuzz.com holds no liability for any investments made based on the information provided on this page. We strongly recommend independent research and/or consultation with a qualified professional before making any investment decisions.
coinmarketbuzz.com leverages advanced AI technology to analyze market data. All content is fact-checked and reviewed by our editorial team to ensure accuracy and neutrality.