Loading News...
Loading...
Loading News...

VADODARA, February 4, 2026 — Bitcoin faces mounting liquidity pressure as on-chain metrics signal potential market capitulation. According to Glassnode liquidity maps, the 90-day Simple Moving Average of Bitcoin's Realized Profit to Loss Ratio approaches critical thresholds. This daily crypto analysis reveals structural weaknesses that mirror previous bear market transitions.
Glassnode data indicates sustained deterioration in Bitcoin's liquidity profile. The analytics firm's 90-day SMA of the Realized Profit to Loss Ratio shows a persistent decline toward the value of one. Market structure suggests this metric measures the balance between profit-taking and loss-realization across the network. When it remains below one, realized losses systematically outpace realized profits.
Historical cycles confirm this pattern precedes significant market events. Glassnode's analysis notes extended periods below this threshold often correlate with market-wide capitulation phases. The current trajectory suggests Bitcoin approaches a similar inflection point. On-chain forensic data confirms increasing selling pressure across multiple UTXO age bands.
Similar to the 2021 correction, current liquidity dynamics reflect classic distribution patterns. In contrast to 2017's parabolic run, today's market shows more sophisticated institutional participation. Underlying this trend, post-merge issuance dynamics create different fundamental pressures. Historically, liquidity contractions of this magnitude preceded the 2018-2019 bear market transition.
Consequently, market participants face familiar psychological thresholds. The Federal Reserve's monetary policy documentation shows tightening cycles typically exacerbate crypto liquidity conditions. , recent developments in related markets highlight broader risk-off sentiment. For context, see related coverage on Nansen's new Layer 1 tracking index and Wintermute's volatility predictions.
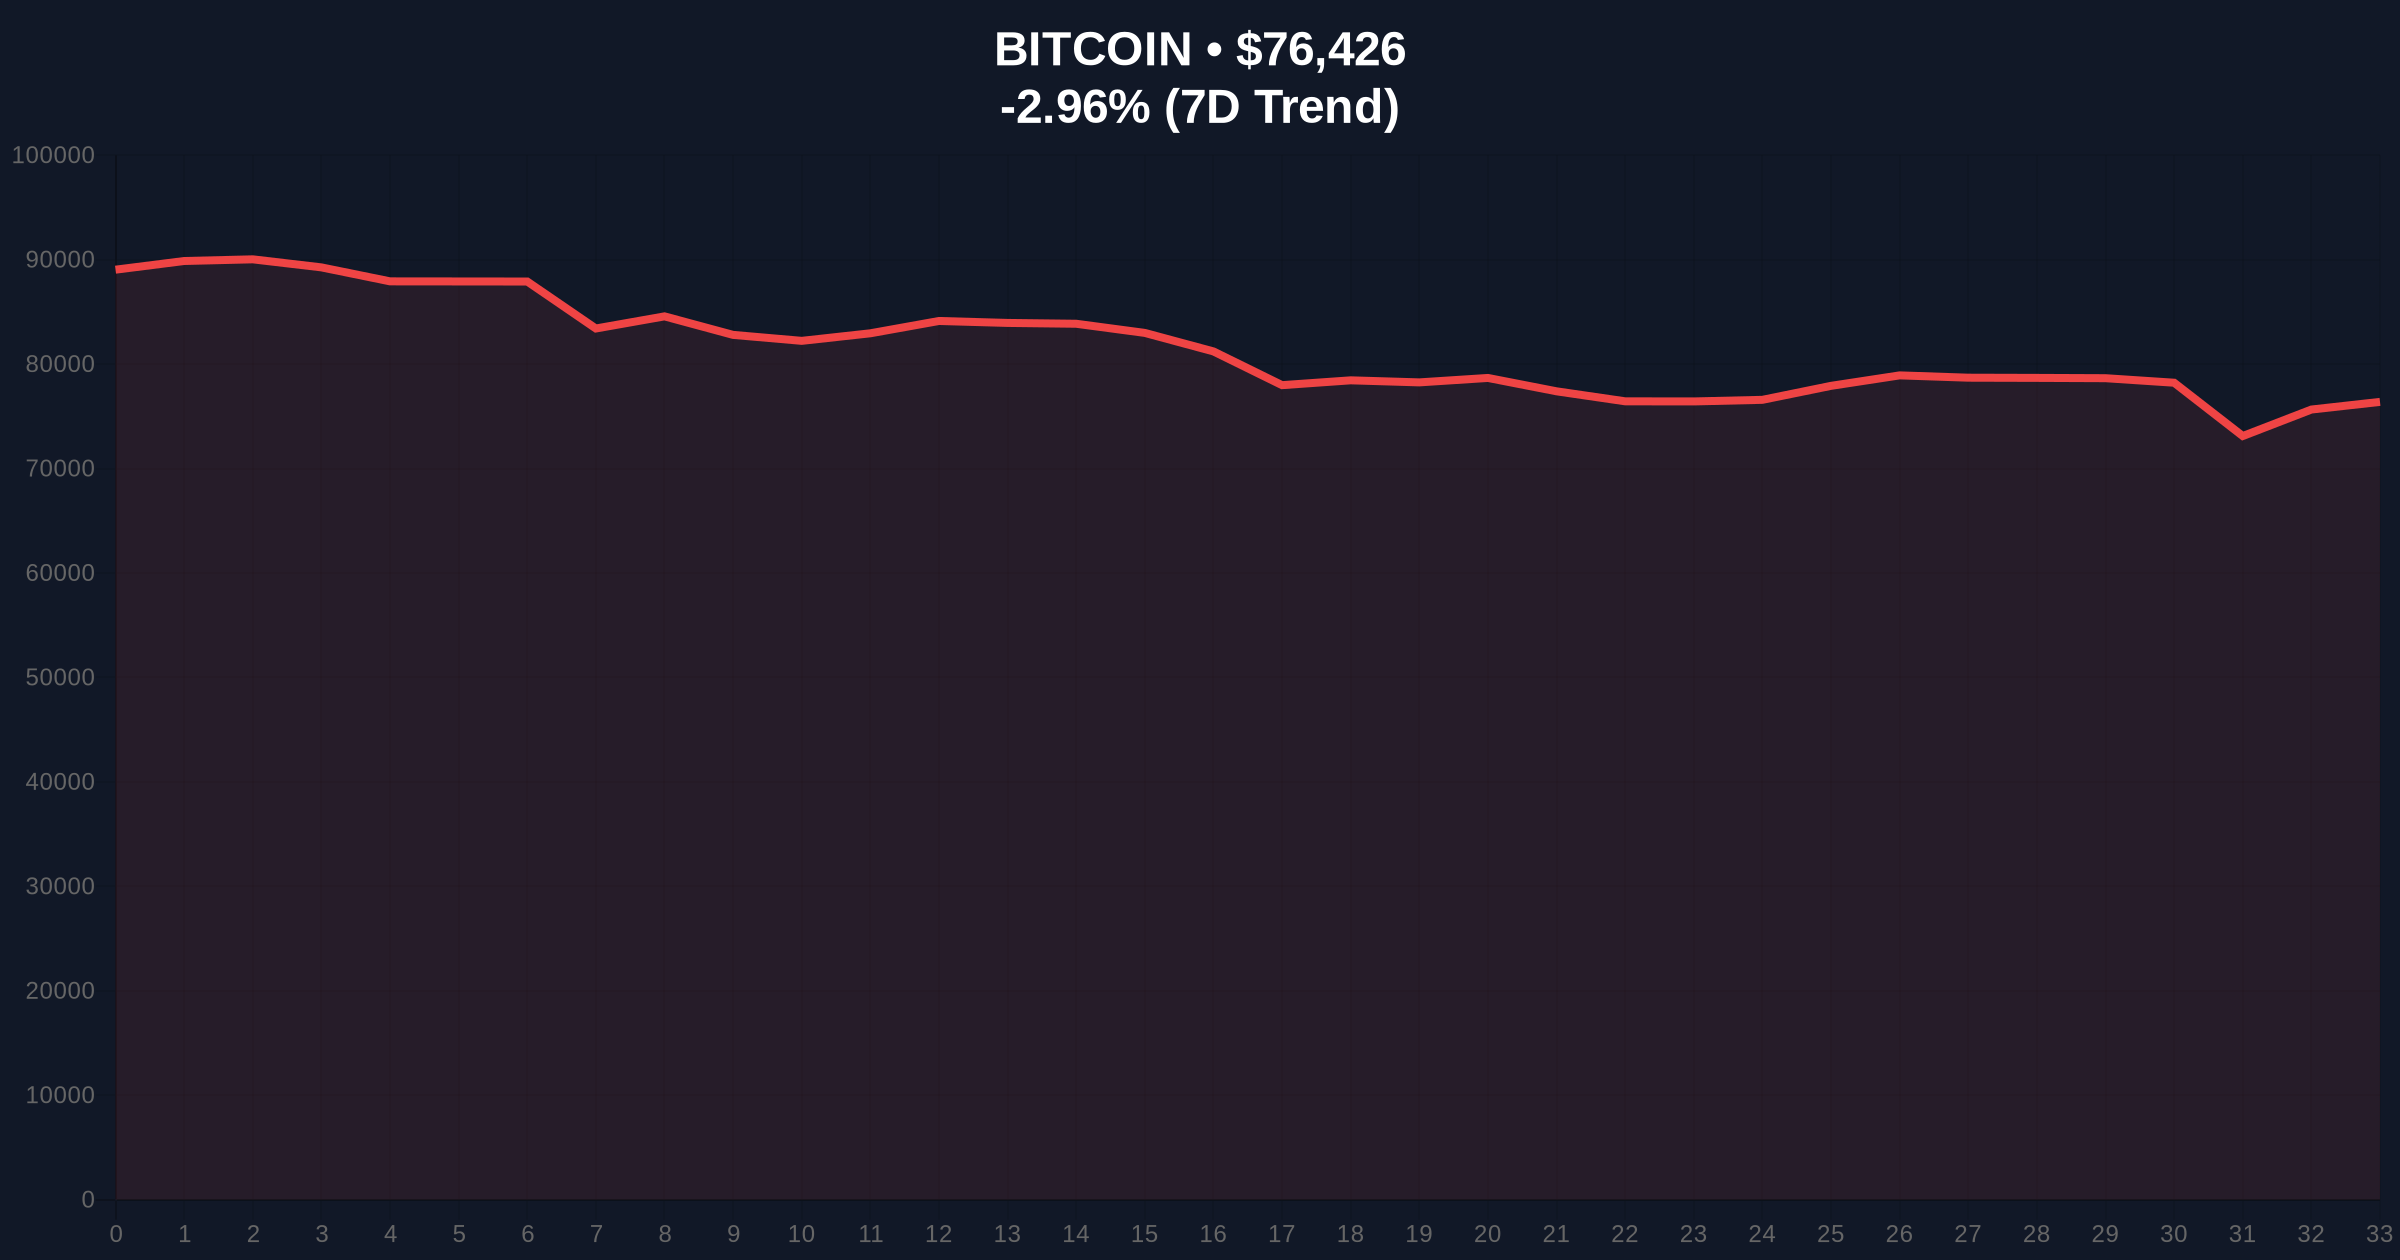
Bitcoin currently trades at $76,399, representing a 24-hour decline of 2.99%. Technical analysis reveals critical support at the Fibonacci 0.618 retracement level of $74,200. This level corresponds with the 200-day moving average and represents a major Order Block. Market structure suggests a break below this creates a Fair Value Gap targeting $68,500.
Volume Profile analysis shows thinning liquidity above $78,000. The Relative Strength Index sits at 38, indicating neither oversold nor overbought conditions. However, declining on-chain volume suggests weakening conviction. EIP-4844 implementation on Ethereum has diverted some capital flows, creating cross-chain liquidity fragmentation.
| Metric | Value | Significance |
|---|---|---|
| Crypto Fear & Greed Index | 14/100 (Extreme Fear) | Historically precedes buying opportunities |
| Bitcoin Current Price | $76,399 | -2.99% 24h change |
| 90-day SMA P/L Ratio | Approaching 1.0 | Capitulation threshold |
| Fibonacci Key Support | $74,200 | 0.618 retracement level |
| Market Rank | #1 | Dominance at 52.3% |
Liquidity contractions directly impact market efficiency and price discovery. Institutional liquidity cycles typically accelerate during these phases. Retail market structure often breaks first, creating cascading liquidations. Real-world evidence includes recent sovereign Bitcoin movements. The Bhutan government's $14.09M Bitcoin transfer occurred amid similar conditions.
, exchange reserve dynamics show concerning patterns. Binance's SAFU fund added $100M in Bitcoin according to recent reporting, suggesting internal risk management preparations. These actions reflect professional assessment of systemic vulnerabilities.
Market structure suggests we're testing critical liquidity thresholds. The Realized Profit to Loss Ratio approaching one indicates balanced pain distribution. Historically, sustained breaks below this level correlate with capitulation events where weak hands exit en masse. Current on-chain data shows similar accumulation patterns to Q4 2018.
— CoinMarketBuzz Intelligence Desk
Two data-backed technical scenarios emerge from current market structure.
The 12-month institutional outlook depends on liquidity stabilization. If the P/L ratio stabilizes above one, accumulation phases may begin by Q2 2026. However, continued deterioration suggests extended consolidation. This aligns with the 5-year horizon where liquidity crises often create long-term buying opportunities.

Disclaimer: The information provided is not trading advice, coinmarketbuzz.com holds no liability for any investments made based on the information provided on this page. We strongly recommend independent research and/or consultation with a qualified professional before making any investment decisions.
coinmarketbuzz.com leverages advanced AI technology to analyze market data. All content is fact-checked and reviewed by our editorial team to ensure accuracy and neutrality.