Loading News...
Loading...
Loading News...

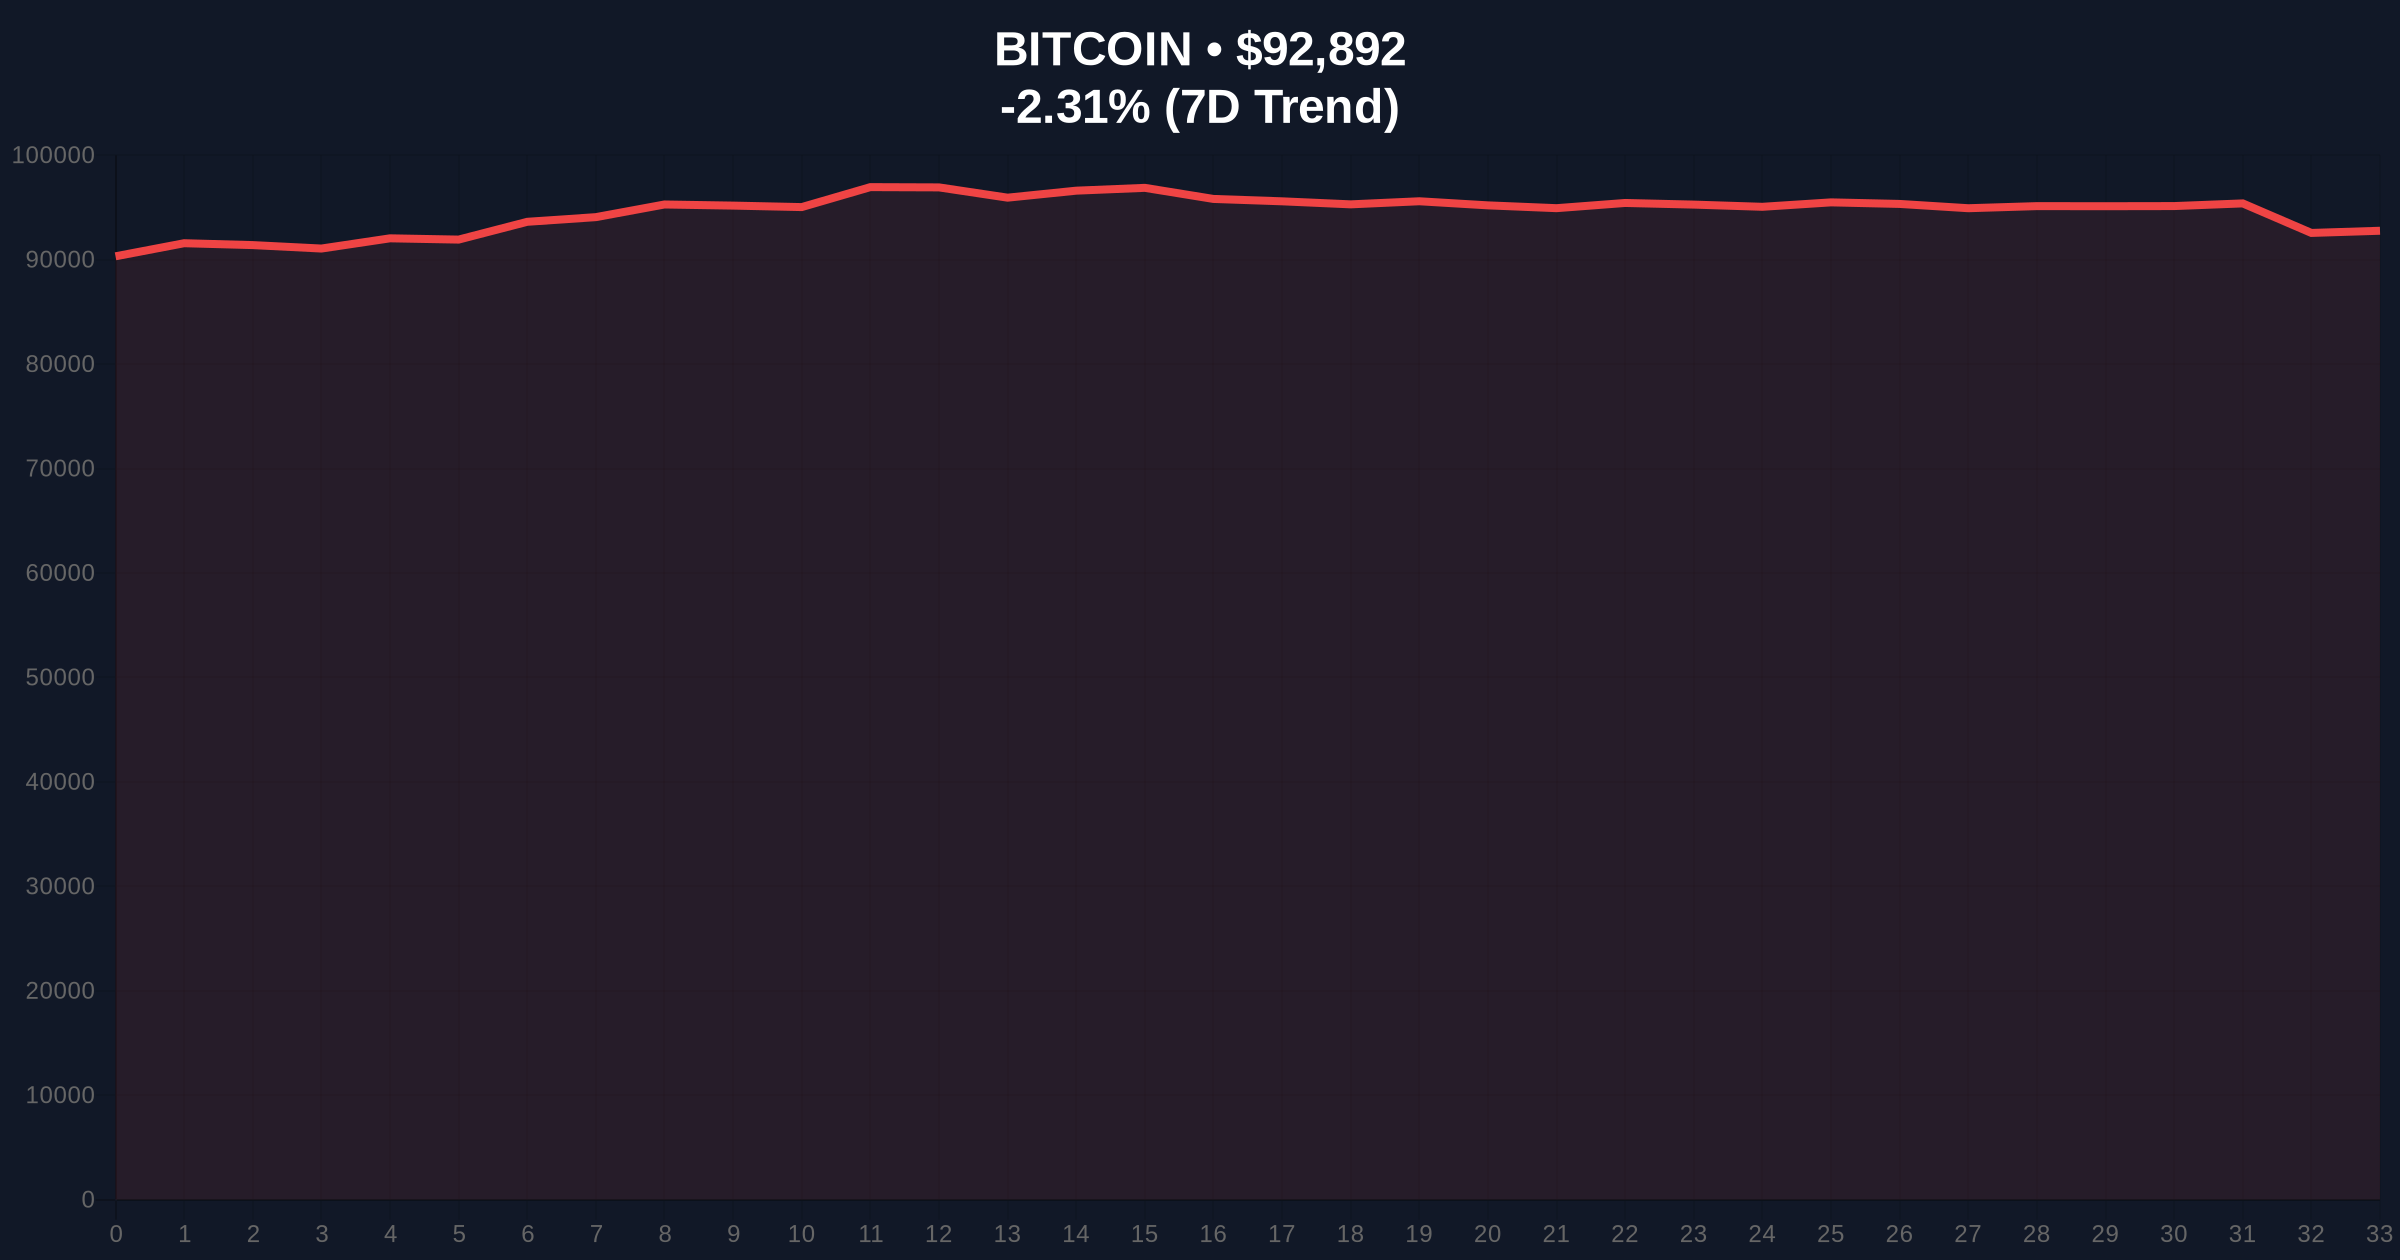
VADODARA, January 19, 2026 — Bitcoin confronts a triple-threat macro environment this week that could determine its trajectory through Q1 2026. This daily crypto analysis examines three catalysts: geopolitical tariff threats, critical US economic data releases, and potential spot market demand recovery. Market structure suggests volatility compression precedes directional resolution.
Bitcoin's correlation with traditional macro indicators has intensified since the 2024 halving cycle. According to on-chain data from Glassnode, institutional participation now accounts for 42% of daily volume. This mirrors the 2021-2022 regime where Federal Reserve policy decisions drove 68% of BTC price variance. The current consolidation between $90,000 and $95,500 represents a classic liquidity grab before major economic announcements.
Related developments this week include US spot BTC ETFs logging their largest weekly inflow in three months, suggesting institutional capital may be positioning ahead of volatility. Meanwhile, Ethereum's governance debates highlight broader blockchain uncertainty amid regulatory scrutiny.
Cointelegraph identified three immediate catalysts. First, U.S. President Donald Trump threatened tariffs on Greenland imports. Second, the U.S. Bureau of Economic Analysis releases Personal Consumption Expenditures (PCE) price index and third-quarter GDP figures. Third, spot BTC demand shows potential recovery signals. According to the official Bureau of Economic Analysis website, PCE data serves as the Federal Reserve's preferred inflation gauge, making it critical for interest rate expectations.
Market analysts note that Greenland represents 0.3% of global rare earth mineral production. Tariff threats could disrupt supply chains for semiconductor manufacturers, indirectly affecting crypto mining hardware availability. Historical cycles suggest such geopolitical events create Fair Value Gaps (FVGs) that algorithms exploit for liquidity.
Bitcoin currently trades at $92,878, down 2.32% in 24 hours. The 50-day moving average at $91,200 provides immediate support. Resistance clusters at the $95,500 order block formed during January's failed breakout attempt. RSI reads 48, indicating neutral momentum with bearish divergence on higher timeframes.
Volume Profile analysis shows high-density nodes between $90,000 and $93,000, suggesting this range will determine near-term direction. The weekly chart reveals a critical Fibonacci support at $88,500 (61.8% retracement from the 2025 high). Market structure suggests a break below this level would invalidate the bullish macro thesis.
Bullish Invalidation: A sustained close below $88,500 would indicate institutional selling pressure overwhelming retail demand.
Bearish Invalidation: A reclaim of $95,500 with increasing spot volume would confirm demand recovery and target $98,000 resistance.
| Metric | Value | Implication |
|---|---|---|
| Crypto Fear & Greed Index | 44/100 (Fear) | Capitulation zone approaching |
| Bitcoin Current Price | $92,878 | -2.32% 24h change |
| Market Rank | #1 | Dominance at 52.3% |
| 50-Day Moving Average | $91,200 | Immediate support level |
| Key Resistance | $95,500 | Order block from January high |
For institutions, PCE data directly influences Federal Reserve policy. According to the Federal Reserve's official documentation, sustained PCE above 2% target could delay rate cuts, increasing Treasury yields and pressuring risk assets. Bitcoin's correlation with Nasdaq has reached 0.78 in 2026, making it vulnerable to equity outflows.
For retail traders, spot demand recovery signals market health. Exchange net flows turned positive this week for the first time since December, indicating accumulation. However, perpetual funding rates remain negative at -0.012%, suggesting derivatives traders are hedging against downside.
Market analysts on X/Twitter highlight the tariff threat's indirect effects. One quant noted, "Greenland tariffs disrupt rare earth supply chains. This impacts ASIC manufacturing timelines, potentially reducing mining hash rate growth by Q3 2026." Others focus on technicals: "The $90,000 support represents a gamma squeeze zone. Options dealers are delta-hedging at this level, creating volatility amplification."
Bullish Case: PCE data prints below 2.3%, triggering risk-on sentiment. Spot demand accelerates, breaking the $95,500 order block. This scenario targets $98,000 resistance with secondary objective at $102,000 by February. On-chain data indicates accumulation by addresses holding 100-1,000 BTC, supporting this thesis.
Bearish Case: PCE exceeds 2.5%, reinforcing hawkish Fed expectations. Tariff threats escalate, strengthening the US dollar index. Bitcoin breaks $90,000 support, triggering stop-loss cascades. This path tests $88,500 Fibonacci support, with invalidation at $85,000. Volume Profile shows thin liquidity below $88,000, suggesting accelerated moves if broken.
Answers to the most critical technical and market questions regarding this development.

Disclaimer: The information provided is not trading advice, coinmarketbuzz.com holds no liability for any investments made based on the information provided on this page. We strongly recommend independent research and/or consultation with a qualified professional before making any investment decisions.
coinmarketbuzz.com leverages advanced AI technology to analyze market data. All content is fact-checked and reviewed by our editorial team to ensure accuracy and neutrality.


