Loading News...
Loading...
Loading News...

VADODARA, January 19, 2026 — U.S. spot Bitcoin and Ethereum exchange-traded funds (ETFs) recorded their largest weekly net inflows in three months, injecting $1.9 billion into the market. This daily crypto analysis examines the structural shift from arbitrage to directional bets. According to CoinDesk, BTC spot ETFs saw total net inflows of $1.42 billion last week, while ETH spot ETFs attracted $479 million. Market structure suggests this is the largest weekly volume since early October, indicating a potential regime change in institutional participation.
This inflow surge follows a prolonged period of subdued ETF activity dominated by basis trade arbitrage. The strategy involved buying spot ETFs while simultaneously selling CME futures to capture the premium. On-chain data indicates this created synthetic selling pressure, suppressing spot price appreciation. The current shift mirrors patterns observed in Q4 2023 before the last major leg up. Related developments include recent liquidity consolidation moves by major exchanges and a notable $100 million ETH withdrawal from Binance, suggesting parallel capital reallocation.
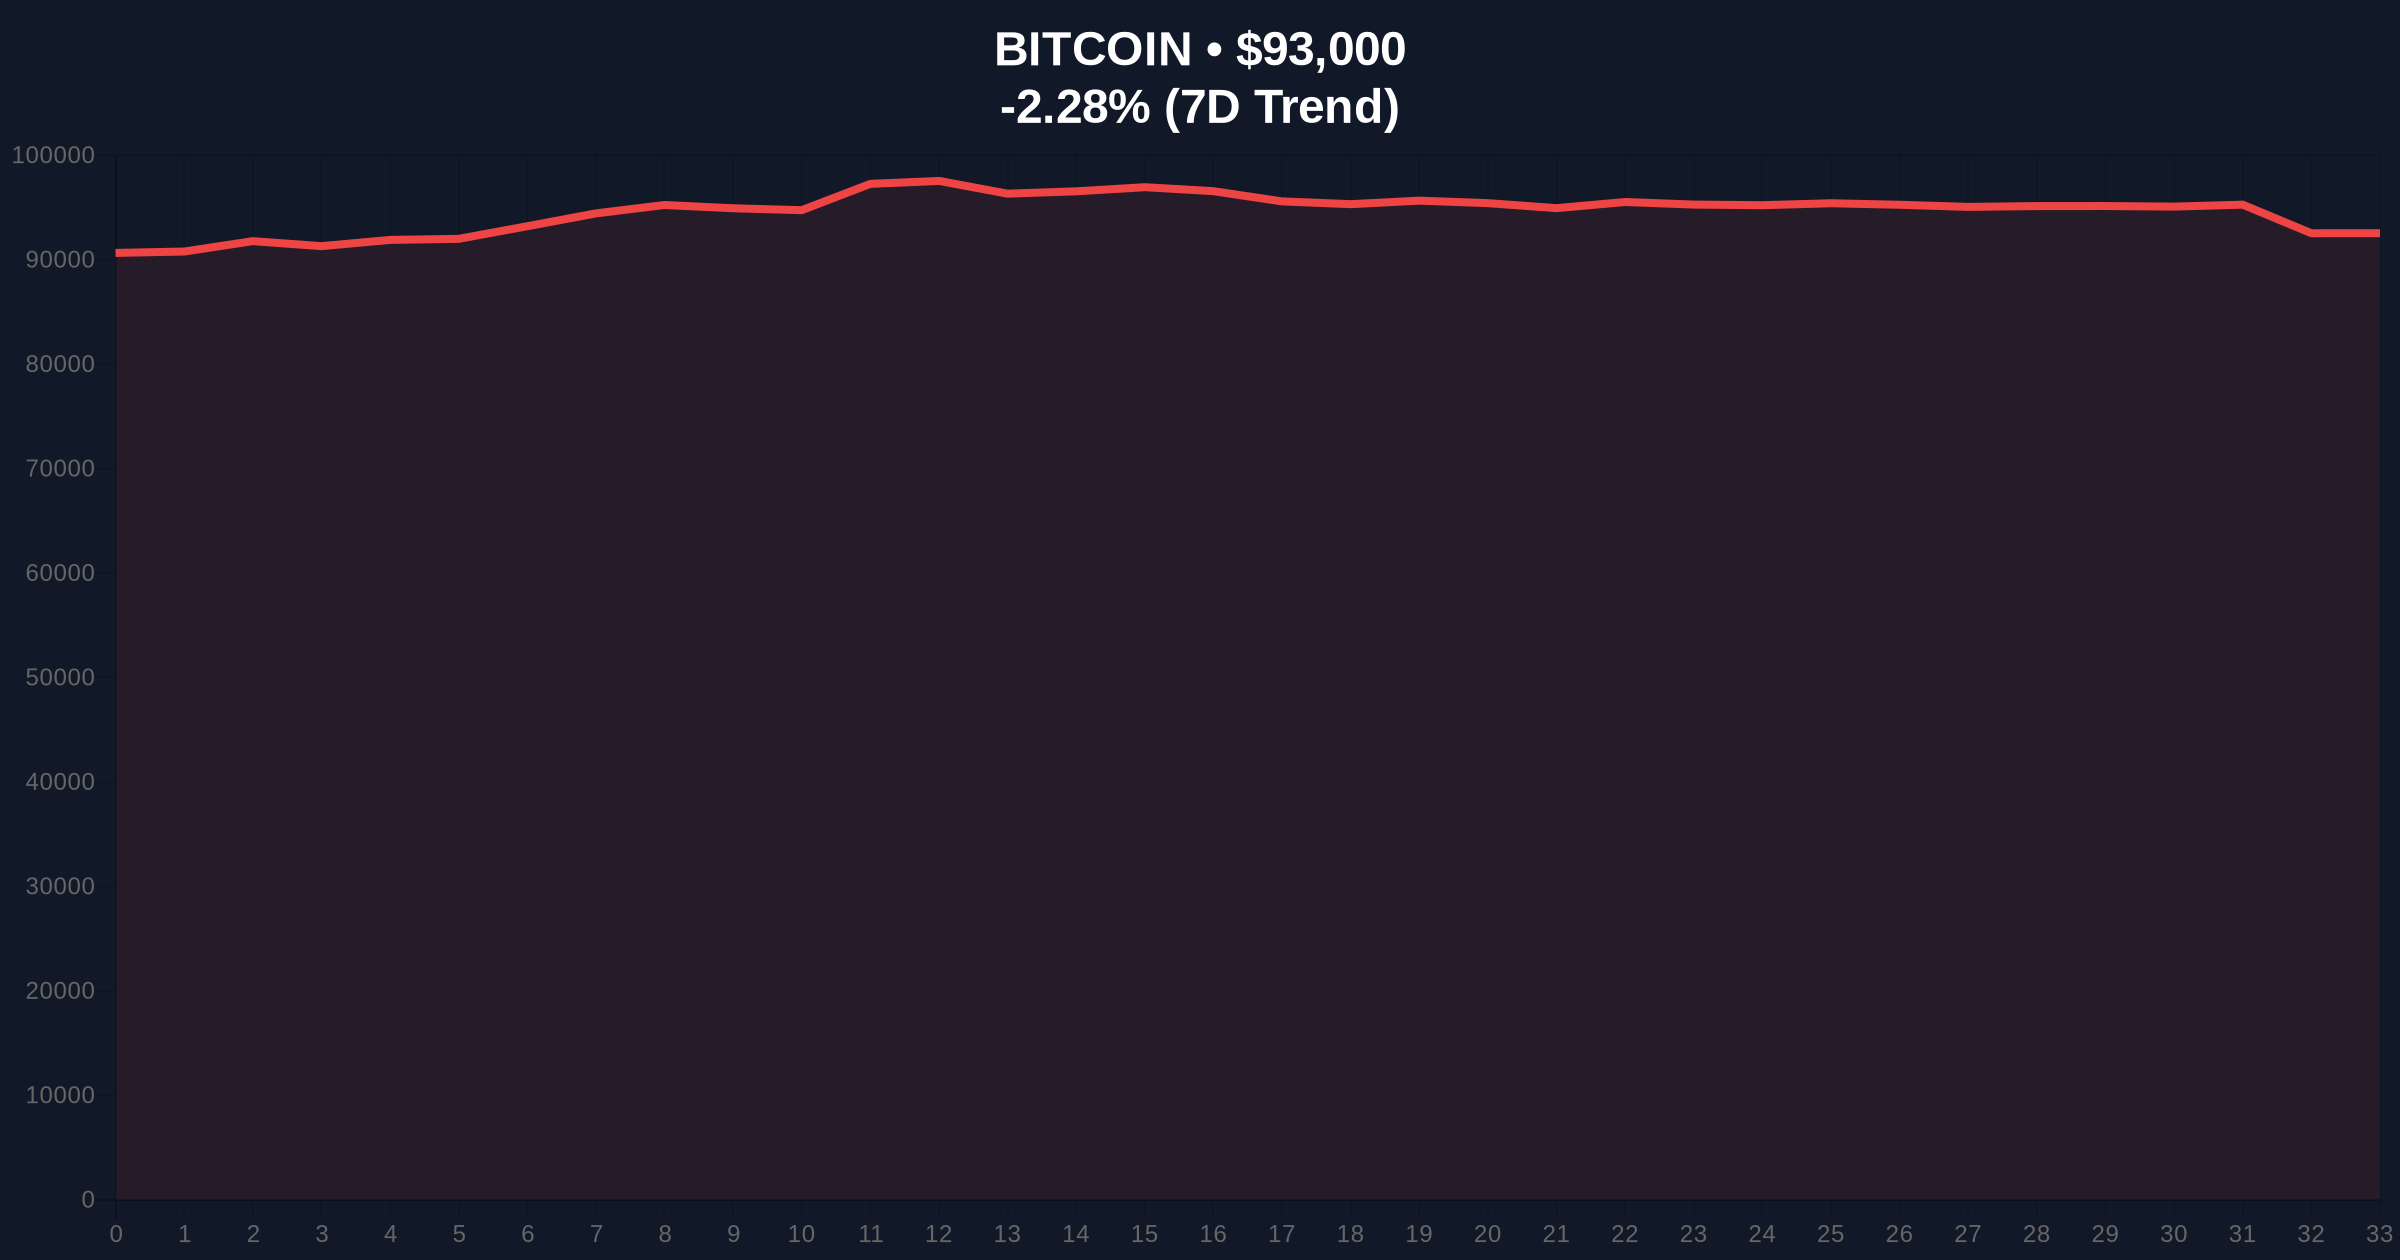
According to CoinDesk analysis, the weekly data shows a definitive break from recent trends. BTC ETF inflows of $1.42 billion and ETH ETF inflows of $479 million represent the highest combined total since early October 2025. The media outlet's analysis frames this as institutional investors returning to build core positions. This move away from pure arbitrage strategies suggests anticipation of regulatory catalysts and macroeconomic variables in Q1 2026. The inflow coincides with Bitcoin trading near $92,962, down 2.31% on the day, creating a clear Fair Value Gap (FVG) between ETF demand and spot price action.
Bitcoin's current price of $92,962 sits within a critical Volume Profile node. Immediate resistance is established at the $94,200 level, a previous Order Block that saw significant liquidation. Support clusters at $90,500, aligning with the 50-day exponential moving average and a high-volume node from December. The 4-hour chart shows a bearish divergence in the RSI, currently at 42, against the price, indicating short-term selling pressure. However, the ETF inflow data suggests underlying bid strength. For Ethereum, the $4,800 level acts as a major psychological and technical barrier, with support at $4,550.
| Metric | Value | Source/Context |
|---|---|---|
| Crypto Fear & Greed Index | 44 (Fear) | Live Market Data |
| Bitcoin Current Price | $92,962 | Live Market Data |
| Bitcoin 24h Change | -2.31% | Live Market Data |
| Weekly BTC ETF Net Inflow | $1.42B | CoinDesk Analysis |
| Weekly ETH ETF Net Inflow | $479M | CoinDesk Analysis |
Institutionally, this flow represents a strategic pivot. The move from arbitrage to directional positioning reduces synthetic sell-side pressure and provides a more stable bid for spot assets. It indicates confidence in the mid-term regulatory outlook, possibly ahead of anticipated guidance from bodies like the SEC. For retail, sustained ETF inflows typically correlate with reduced volatility and stronger support levels, as seen in historical cycles post-ETF approval. The divergence between institutional accumulation (inflows) and retail sentiment (Fear Index at 44) creates a classic contrarian signal.
Market analysts on X/Twitter are interpreting the data as a bullish divergence. One quant noted, "ETF flows are leading price by 2-3 weeks historically. This $1.9B print is a massive liquidity injection into the system." Others point to the timing, suggesting institutions are front-running potential positive catalysts related to the Federal Reserve's upcoming meetings, as detailed in official FOMC calendars. The sentiment among bulls is that this marks the end of the post-halving consolidation phase.
Bullish Case: Sustained weekly inflows above $1 billion could propel Bitcoin to test the $98,000 resistance, a key Fibonacci extension level from the 2024 cycle. Ethereum could target $5,200. This scenario invalidates below $90,500 (Bullish Invalidation). Market structure suggests this level must hold to confirm the institutional bid is structural, not tactical.
Bearish Case: If inflows revert to neutral or negative in the coming week, it would signal the move was a one-off rebalancing. Price could retreat to fill the FVG down to $88,000. A break below $90,500 with high volume would target the $85,000 support zone (Bearish Invalidation). This would indicate the institutional narrative has failed to gain traction.
Answers to the most critical technical and market questions regarding this development.

Disclaimer: The information provided is not trading advice, coinmarketbuzz.com holds no liability for any investments made based on the information provided on this page. We strongly recommend independent research and/or consultation with a qualified professional before making any investment decisions.
coinmarketbuzz.com leverages advanced AI technology to analyze market data. All content is fact-checked and reviewed by our editorial team to ensure accuracy and neutrality.