Loading News...
Loading...
Loading News...

VADODARA, February 3, 2026 — Galaxy Digital Head of Research Alex Thorn warns Bitcoin could face extended selling pressure toward $58,000. This latest crypto news follows a 15% January decline that liquidated over $2 billion in long positions. Market structure suggests this mirrors historical capitulation phases.
Alex Thorn detailed his bearish thesis on social media platform X. He cited three primary factors: weak on-chain data, growing macroeconomic uncertainty, and a lack of upward catalysts. According to Thorn, Bitcoin broke through key support levels, triggering the current downtrend.
He specifically identified the 200-week moving average at $58,000 as a potential target. This level represents a critical long-term technical benchmark. Thorn noted approximately 46% of the total Bitcoin supply currently sits at a loss. This metric matches levels observed during previous bear markets like 2018-2019 and 2022.
, Thorn anticipates possible sideways movement within a 10% range of the average spot Bitcoin ETF purchase price of $84,000. However, he believes selling pressure will persist without clear demand improvement. The analysis stems from Galaxy Digital's institutional research framework.
Historically, Bitcoin has experienced similar supply-in-loss scenarios. During the 2022 bear market, supply in loss peaked near 50%. That cycle saw Bitcoin bottom at $15,500. The current 46% level suggests comparable distribution pressure.
In contrast, the 2021 bull run maintained supply in loss below 30% for extended periods. The current metric indicates significant underwater positions. Consequently, any price rally faces immediate selling pressure from capitulating holders.
Market analysts observe parallel developments in other sectors. For instance, the recent Ethereum sell-off by a Vitalik Buterin-linked address reflects broader institutional caution. Similarly, CryptoQuant's on-chain analysis validates these long-term trend concerns.
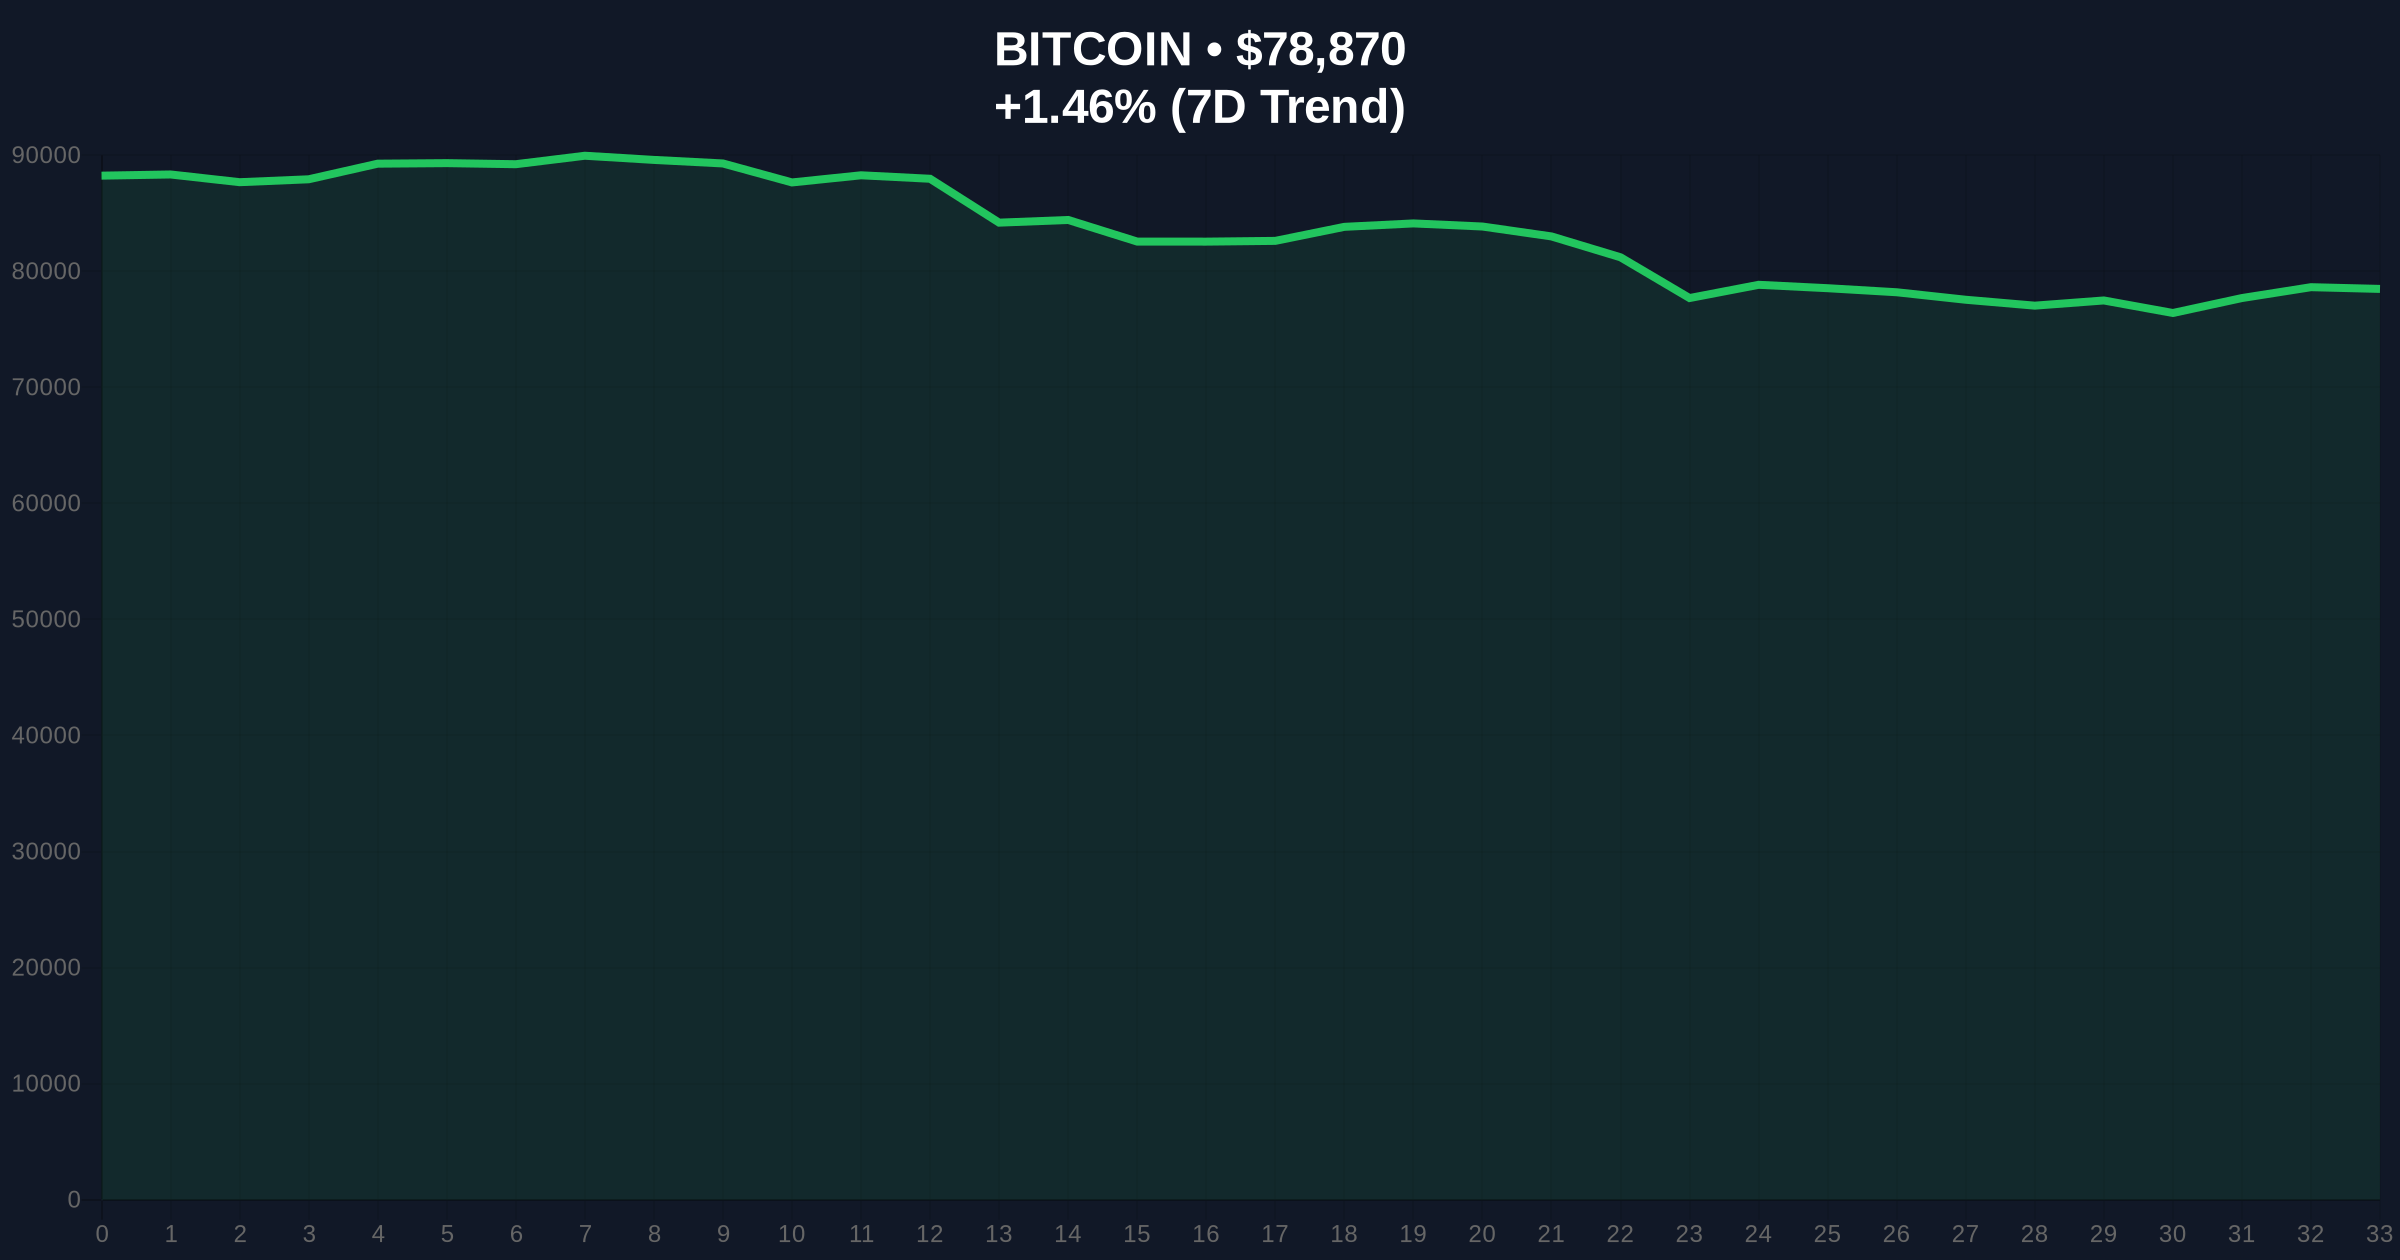
Market structure suggests Bitcoin faces a critical Fair Value Gap (FVG) between $78,000 and $82,000. This gap formed during the January decline. Price must reclaim this zone to invalidate the bearish structure.
The 200-week moving average at $58,000 acts as major support. A break below would target the 0.786 Fibonacci retracement level near $52,000. Conversely, resistance clusters at the 50-day EMA around $84,000.
On-chain data indicates weak holder conviction. Short-term holder realized price sits near $75,000, creating immediate resistance. The Volume Profile shows low activity above $85,000, confirming lack of demand. This technical setup resembles the distribution phase of early 2022.
| Metric | Value | Implication |
|---|---|---|
| Current Bitcoin Price | $78,868 | Testing key support zone |
| 24-Hour Change | +1.31% | Minor bounce within downtrend |
| Crypto Fear & Greed Index | 17/100 (Extreme Fear) | Historically precedes capitulation |
| Supply in Loss | 46% | Matches past bear market levels |
| 200-WMA Target | $58,000 | Critical long-term support |
This analysis matters for portfolio risk management. A drop to $58,000 would represent a 26% decline from current levels. Such a move would test Bitcoin ETF inflow sustainability. Institutional buyers entered at average prices near $84,000.
, macroeconomic uncertainty compounds technical weakness. The Federal Reserve's monetary policy decisions directly impact risk assets. According to the Federal Reserve's latest statements, rate cut expectations have diminished. This creates headwinds for cryptocurrency valuations.
Market structure suggests retail traders face maximum pain. The $2 billion in long liquidations indicates overleveraged positions. Consequently, deleveraging cycles typically last 4-8 weeks. This aligns with Thorn's "weeks to months" timeframe.
"The 46% supply-in-loss metric historically correlates with distribution phases. Without new demand catalysts, Bitcoin likely tests lower support levels. The 200-week moving average at $58,000 represents the next logical target based on historical volatility bands."— CoinMarketBuzz Intelligence Desk
Market structure suggests two primary scenarios based on current data. The bearish scenario involves continued distribution toward $58,000. The bullish scenario requires reclaiming key resistance levels.
The 12-month institutional outlook remains cautious. Without clear macroeconomic improvement or new adoption catalysts, sideways-to-lower price action dominates. However, historical cycles suggest extreme fear periods often precede major accumulation opportunities. The 5-year horizon remains positive given Bitcoin's structural scarcity and institutional adoption trajectory.

Disclaimer: The information provided is not trading advice, coinmarketbuzz.com holds no liability for any investments made based on the information provided on this page. We strongly recommend independent research and/or consultation with a qualified professional before making any investment decisions.
coinmarketbuzz.com leverages advanced AI technology to analyze market data. All content is fact-checked and reviewed by our editorial team to ensure accuracy and neutrality.


