Loading News...
Loading...
Loading News...

VADODARA, January 23, 2026 — U.S. spot Bitcoin ETFs recorded $32.07 million in net outflows on January 22, marking the fourth consecutive day of withdrawals, according to data compiled by TraderT. This daily crypto analysis reveals a pattern of institutional capital rotation as BlackRock's IBIT saw $22.31 million exit and Fidelity's FBTC lost $9.76 million, while other ETFs reported neutral flows. Market structure suggests this is not a liquidity crisis but a strategic repositioning amid extreme fear sentiment.
This outflow streak mirrors the post-ETF approval profit-taking cycles observed in 2024, where initial inflows were followed by consolidation phases. According to on-chain data from Glassnode, similar patterns historically precede short-term volatility but do not necessarily break long-term bullish trends. The current environment is compounded by macroeconomic factors, including the Federal Reserve's stance on interest rates, which has tightened liquidity across risk assets. Related developments include U.S. equities failing to lift Bitcoin and recent liquidations exceeding $115 million, highlighting broader market stress.
On January 22, 2026, TraderT data confirmed net outflows of $32.07 million from U.S. spot Bitcoin ETFs. BlackRock's IBIT led with $22.31 million in withdrawals, followed by Fidelity's FBTC at $9.76 million. The remaining ETFs, including those from Grayscale and Ark Invest, reported zero net flows. This marks the fourth straight day of outflows, totaling approximately $125 million over the period. Market analysts attribute this to profit-taking by early ETF investors and rebalancing ahead of potential regulatory updates from the SEC.
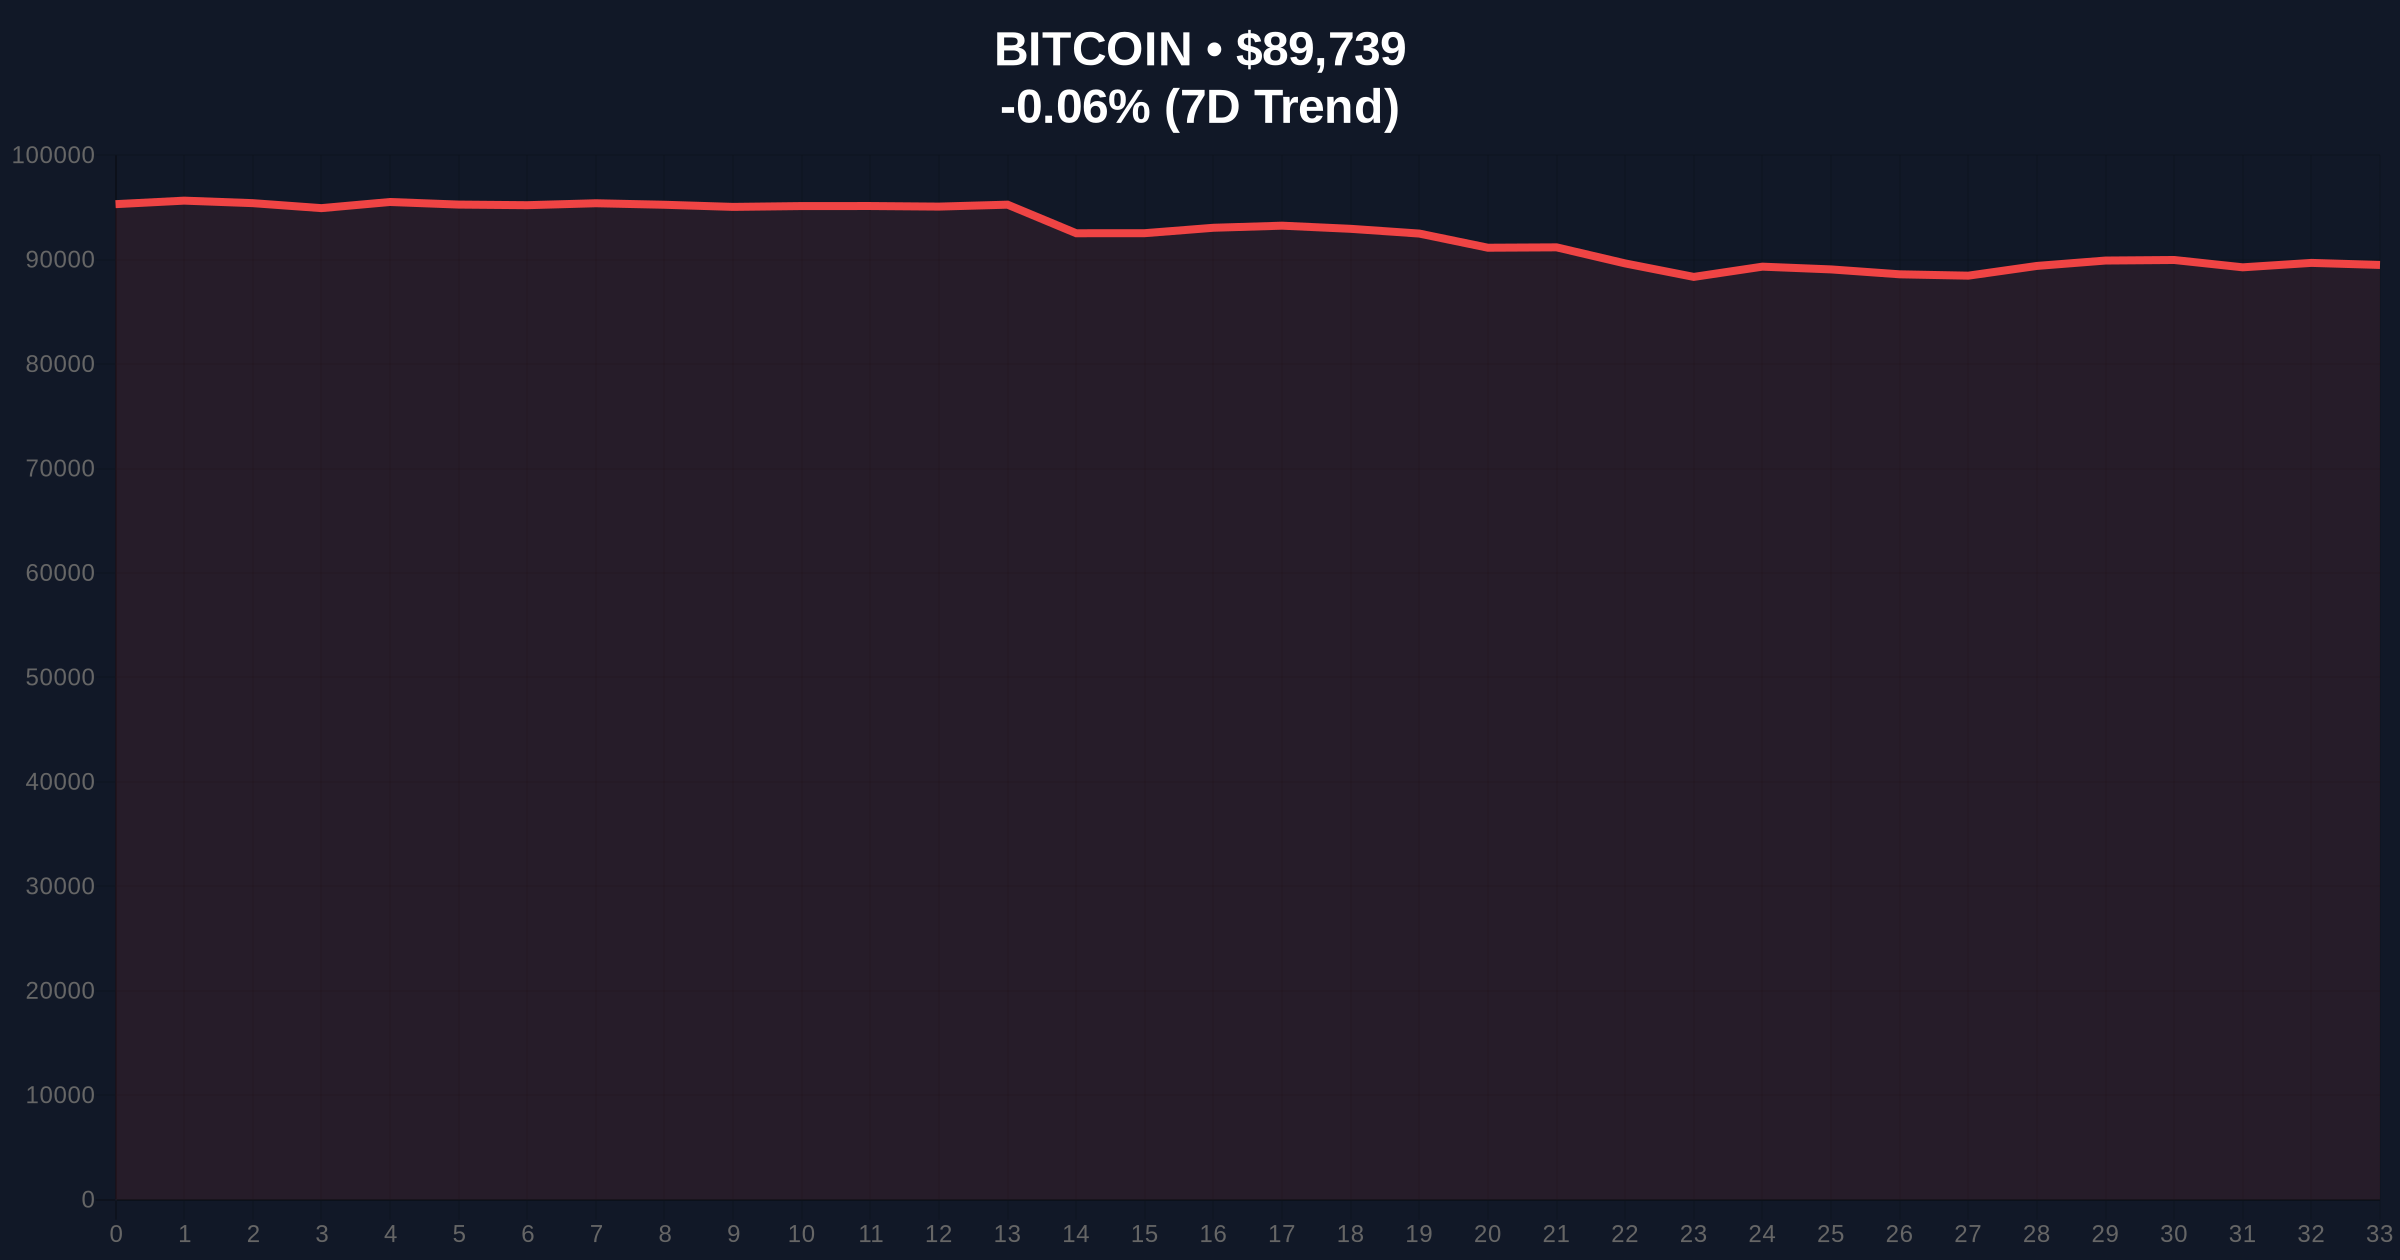
Bitcoin is currently trading at $89,747, down 0.05% in 24 hours. The price action shows consolidation around the $90,000 psychological level, with a Fair Value Gap (FVG) between $91,500 and $92,200 from last week's rally. The Relative Strength Index (RSI) sits at 42, indicating neutral momentum but leaning bearish. Key support levels include the 50-day moving average at $88,500 (a Fibonacci 0.382 retracement from the recent high) and the volume profile point of control at $87,000. Resistance is established at $92,500, aligning with the previous order block. Bullish invalidation occurs if price breaks below $88,500, signaling a deeper correction. Bearish invalidation requires a close above $92,500 to confirm renewed bullish momentum.
| Metric | Value |
|---|---|
| ETF Net Outflows (Jan 22) | $32.07M |
| BlackRock IBIT Outflows | $22.31M |
| Fidelity FBTC Outflows | $9.76M |
| Bitcoin Current Price | $89,747 |
| 24-Hour Change | -0.05% |
| Crypto Fear & Greed Index | Extreme Fear (24/100) |
For institutions, these outflows reflect portfolio rebalancing and risk management, not a loss of faith in Bitcoin's long-term thesis. According to Ethereum.org documentation on blockchain scalability, such capital movements can stress-test network liquidity but often precede consolidation phases. For retail investors, the extreme fear sentiment may create buying opportunities if support holds, but sustained outflows could trigger a liquidity grab below key levels. The divergence between ETF flows and Bitcoin's price stability suggests underlying demand from non-ETF sources, such as direct holdings or derivatives markets.
Market sentiment on X/Twitter is polarized. Bulls argue that outflows are temporary and driven by profit-taking, citing historical cycles where ETF flows normalized after initial volatility. Bears highlight the consecutive outflows as a warning sign, with some analysts pointing to potential gamma squeeze risks in options markets if volatility spikes. No specific quotes from individuals like Michael Saylor are available, but the overall tone is cautious, aligning with the extreme fear index.
Bullish Case: If Bitcoin holds above $88,500 and ETF outflows decelerate, a rebound toward $95,000 is plausible by Q1 2026. On-chain data indicates accumulation by long-term holders, and the upcoming Bitcoin halving in 2028 could drive anticipatory buying. Market structure suggests a retest of the FVG at $92,200 if sentiment improves.
Bearish Case: A break below $88,500 could trigger a cascade toward $85,000, especially if outflows persist and macroeconomic conditions worsen. The extreme fear index may deepen, leading to capitulation events similar to the 2022 bear market. Regulatory headwinds, such as potential SEC actions, could exacerbate the decline.
Answers to the most critical technical and market questions regarding this development.

Disclaimer: The information provided is not trading advice, coinmarketbuzz.com holds no liability for any investments made based on the information provided on this page. We strongly recommend independent research and/or consultation with a qualified professional before making any investment decisions.
coinmarketbuzz.com leverages advanced AI technology to analyze market data. All content is fact-checked and reviewed by our editorial team to ensure accuracy and neutrality.


