Loading News...
Loading...
Loading News...

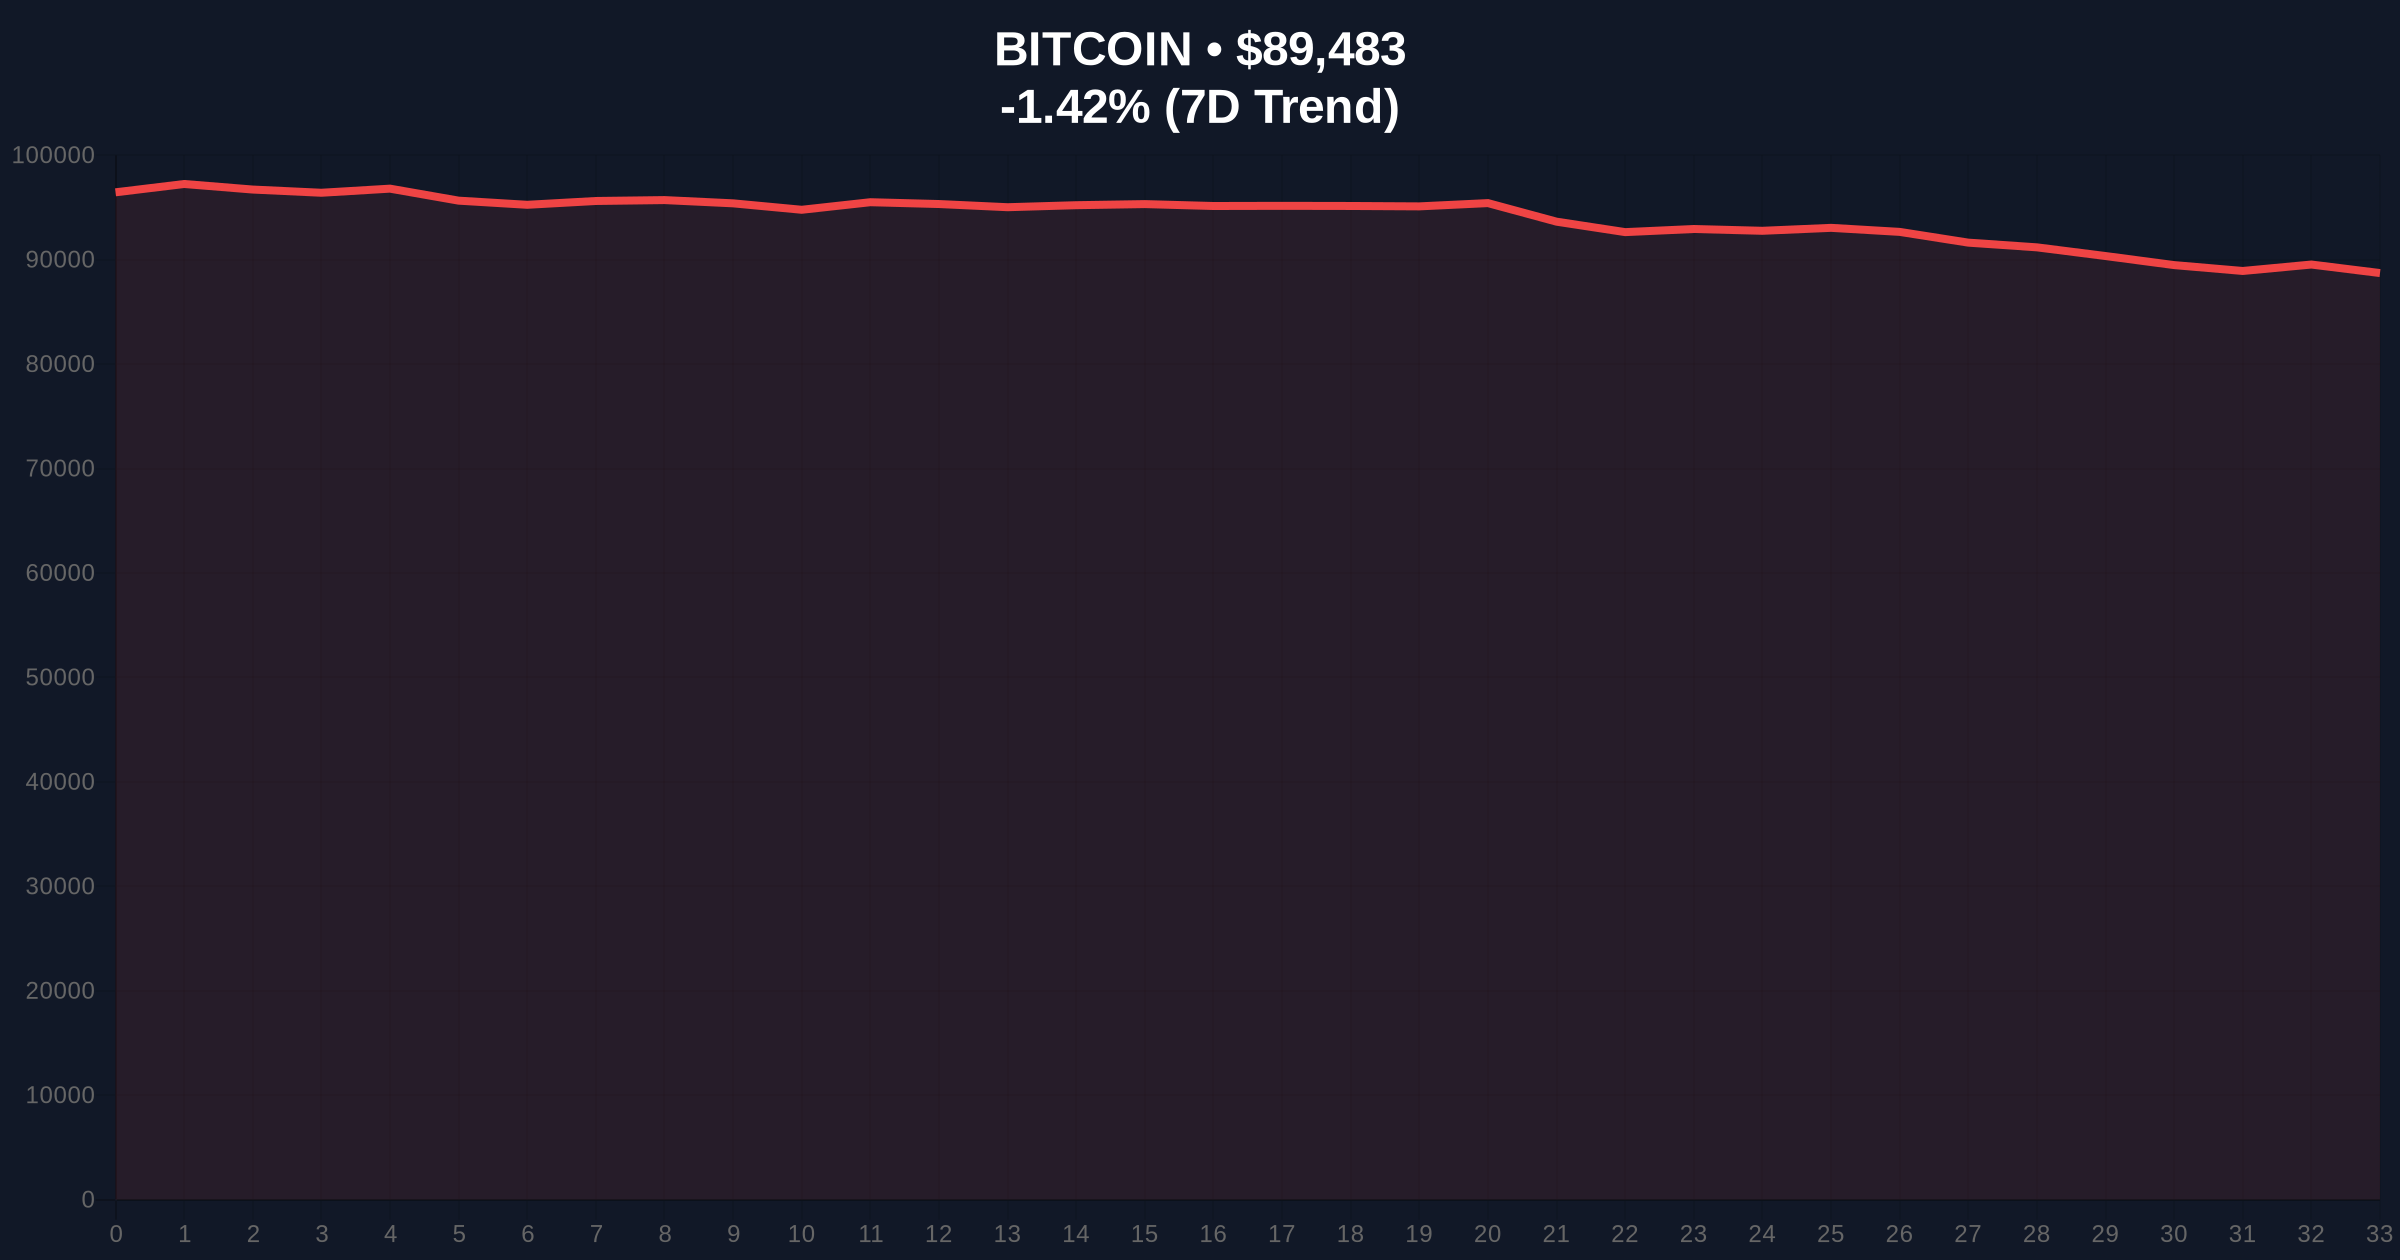
VADODARA, January 21, 2026 — The three major U.S. stock indexes opened higher on Tuesday, with the S&P 500 up 0.44%, the Nasdaq Composite up 0.35%, and the Dow Jones Industrial Average up 0.33%, according to market data from major financial terminals. This daily crypto analysis reveals a critical divergence: Bitcoin traded at $89,794, down 1.08% over 24 hours, while the Crypto Fear & Greed Index registered "Extreme Fear" at a score of 24/100. Market structure suggests this disconnect may indicate a liquidity grab in crypto assets, as traditional risk-on sentiment fails to propagate into digital markets.
Historically, Bitcoin and major tech-heavy indexes like the Nasdaq have shown periods of high correlation, particularly during macro-driven liquidity events. The current decoupling mirrors patterns observed in late 2022, when Federal Reserve tightening cycles initially pressured risk assets uniformly before sector-specific weaknesses emerged. According to on-chain data from Glassnode, Bitcoin's realized price—a key metric tracking the average acquisition cost of all coins—has been trending downward, suggesting distribution by longer-term holders. This context is critical for understanding why a stock market rally might not translate to crypto gains. Related developments include the White House's recent statements on bank crypto entry under the CLARITY Act, which could reshape institutional flows, and corporate rebranding efforts like KindlyMD to Nakamoto amid market stress.
On January 21, 2026, U.S. equity markets opened positively, with the S&P 500, Nasdaq, and Dow all posting gains between 0.33% and 0.44%. This movement was reported by financial data aggregators and reflected in real-time trading feeds. Simultaneously, Bitcoin's price action showed weakness, declining 1.08% to $89,794. The Crypto Fear & Greed Index, a sentiment gauge derived from volatility, market momentum, social media, and surveys, plummeted to 24, indicating "Extreme Fear." This juxtaposition creates a Fair Value Gap (FVG) between expected risk-on behavior and actual crypto performance, raising questions about underlying market mechanics.
Bitcoin's current price of $89,794 sits below its 50-day exponential moving average (EMA), a key dynamic resistance level. The Relative Strength Index (RSI) on the daily chart is hovering near 45, suggesting neutral momentum with a bearish bias. Volume profile analysis indicates low participation during the recent dip, potentially signaling a lack of conviction from sellers. A critical Fibonacci retracement level from the 2025 high to the 2026 low provides support at $87,500, which aligns with a prior order block from December 2025. Bullish invalidation is set at $87,500; a break below this level would confirm a bearish structure and target lower liquidity pools. Bearish invalidation lies at $92,000, where a sustained move above could fill the FVG and realign with equity strength.
| Metric | Value | Change |
|---|---|---|
| S&P 500 Open | 0.44% | Up |
| Nasdaq Composite Open | 0.35% | Up |
| Dow Jones Industrial Average Open | 0.33% | Up |
| Bitcoin Price | $89,794 | -1.08% (24h) |
| Crypto Fear & Greed Index | 24/100 | Extreme Fear |
For institutional investors, this divergence highlights the evolving nature of crypto as an asset class. While traditional equities respond to macroeconomic indicators like the Federal Reserve's interest rate decisions—detailed in official statements on FederalReserve.gov—crypto markets may be driven more by internal factors such as miner capitulation or regulatory uncertainty. Retail traders face increased volatility risk, as sentiment extremes often precede sharp moves. The disconnect suggests that crypto is not merely a "risk-on" proxy but has developed idiosyncratic drivers, including regulatory developments like those seen in Italy's stance on stablecoins.
Market analysts on social media platforms express skepticism about the sustainability of the stock rally, citing overbought conditions in tech stocks. Bulls argue that crypto weakness is a temporary liquidity squeeze, while bears point to on-chain data showing increased exchange inflows, suggesting selling pressure. No direct quotes from high-profile figures like Michael Saylor are available, but sentiment aggregates indicate a cautious outlook, with many awaiting clearer signals from key support levels.
Bullish Case: If Bitcoin holds above the $87,500 Fibonacci support and the Fear & Greed Index rebounds from extreme levels, a mean reversion could target $92,000. This scenario would require a gamma squeeze in derivatives markets or positive regulatory clarity, such as progress on the CLARITY Act.
Bearish Case: A break below $87,500 invalidates the current consolidation, potentially triggering a liquidation cascade toward $85,000. This would be exacerbated by continued outflows from spot Bitcoin ETFs or adverse regulatory news, similar to pressures noted in Solana's regulatory challenges.
Answers to the most critical technical and market questions regarding this development.

Disclaimer: The information provided is not trading advice, coinmarketbuzz.com holds no liability for any investments made based on the information provided on this page. We strongly recommend independent research and/or consultation with a qualified professional before making any investment decisions.
coinmarketbuzz.com leverages advanced AI technology to analyze market data. All content is fact-checked and reviewed by our editorial team to ensure accuracy and neutrality.