Loading News...
Loading...
Loading News...

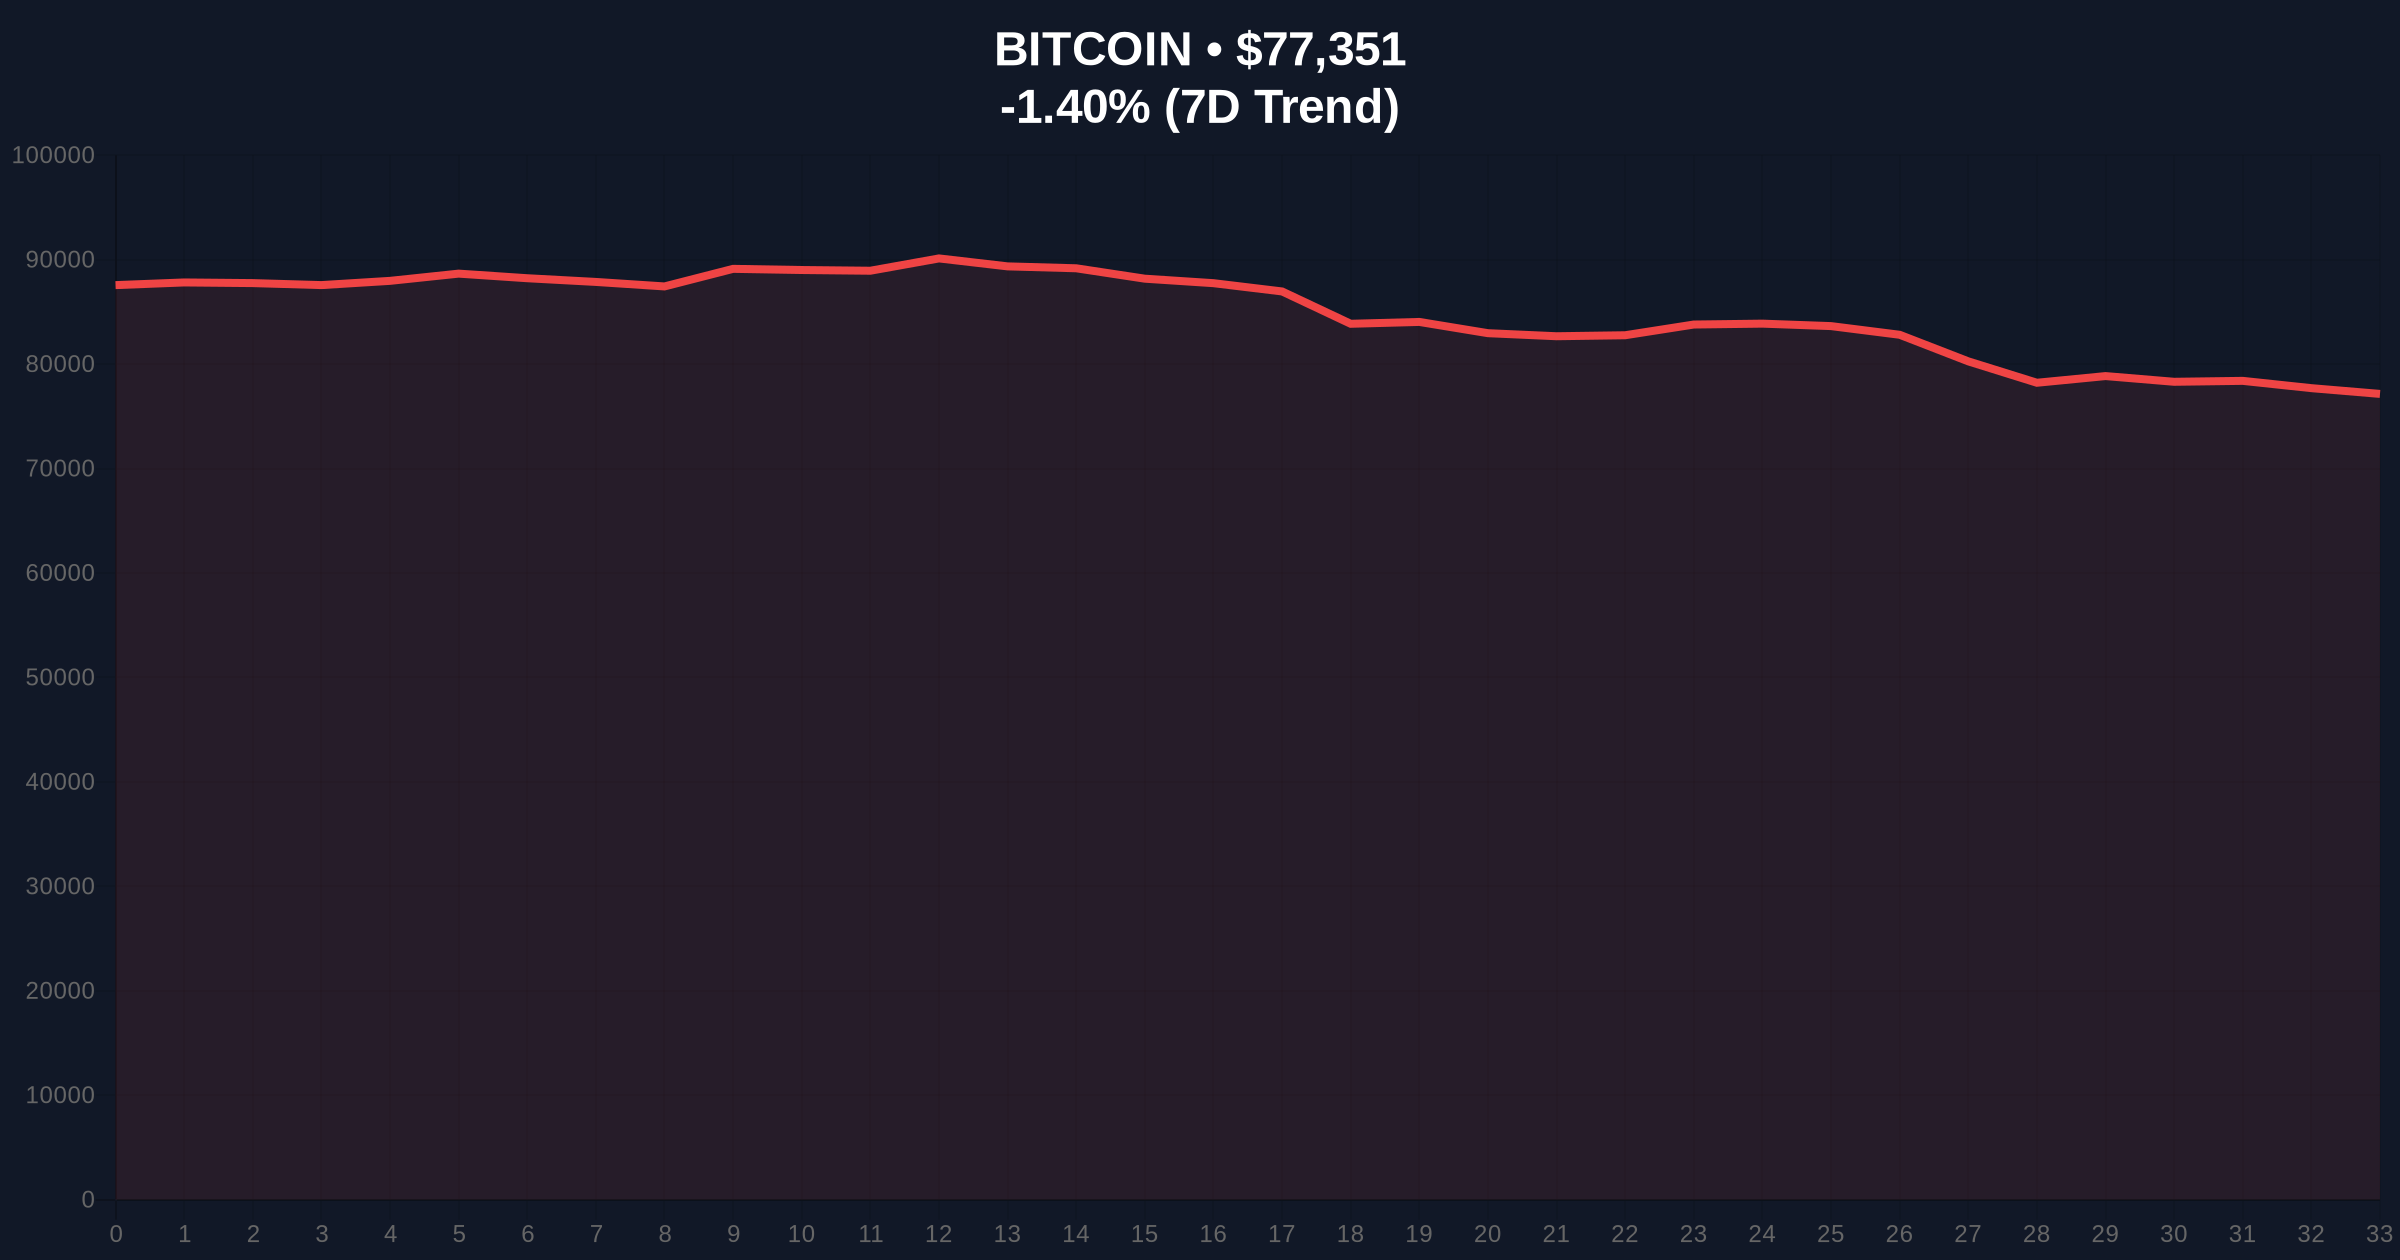
VADODARA, February 2, 2026 — Bitcoin has entered a downward trend that could persist for several months, with technical indicators pointing to a potential decline to the mid-$50,000s, according to former NYSE Arca options trader Eric Crown. In a detailed interview with CoinDesk, Crown cited bearish signals from moving averages and a monthly MACD dead cross, framing the current phase as a value accumulation opportunity rather than a cycle end. This daily crypto analysis examines the structural underpinnings of the slide.
Eric Crown diagnosed Bitcoin's sideways and declining phase since October 2025. He highlighted a dead cross on the monthly MACD, a lagging indicator that signals long-term bearish momentum. Crown also pointed to bearish divergences from the 21-day and 55-day weekly moving averages. These technical tools suggest weakening buyer support. Market structure indicates a liquidity grab below key psychological levels.
According to Crown, traders have grown wary of re-entering positions after October's largest-ever forced liquidation event. This event created a significant Fair Value Gap (FVG) that price action has yet to fill. On-chain data from Glassnode shows increased UTXO age bands moving to exchanges, signaling profit-taking by long-term holders. Consequently, the market faces sustained selling pressure.
Historically, Bitcoin corrections of 30-50% align with mid-cycle consolidations, similar to the 2021 summer drawdown. That period saw a 53% drop from $64,000 to $30,000 over three months. In contrast, the current downtrend began in October 2025, mirroring past deleveraging phases. Underlying this trend is a shift from speculative retail froth to institutional accumulation, as seen in ETF flow data.
Market analysts note that investors typically sell speculative assets first during downturns, exacerbating altcoin weakness. Related developments include stalled capital inflows and early investor profit-taking and negative returns for BlackRock's IBIT ETF investors. These factors compound the bearish technical outlook.
Bitcoin currently trades at $77,379, down 1.36% in 24 hours. Key support levels include the 200-day moving average near $75,000 and the Fibonacci 0.618 retracement level at $70,000. Resistance sits at the 21-day EMA around $82,000. The monthly MACD dead cross, last observed in early 2022, preceded a 65% decline. Volume profile analysis indicates thin liquidity below $75,000, risking a swift drop.
Ethereum's official Pectra upgrade documentation suggests broader network improvements may not offset macro headwinds. A break below the $75,000 order block could invalidate the current range-bound structure. Market structure suggests this aligns with Crown's mid-$50,000 target, representing a 35% correction from recent highs.
| Metric | Value | Implication |
|---|---|---|
| Crypto Fear & Greed Index | 14/100 (Extreme Fear) | High capitulation risk, often a contrarian signal |
| Bitcoin Current Price | $77,379 | Testing key support, down 1.36% in 24h |
| Trader Target (Low) | Mid-$50,000s | Potential 35% decline from current levels |
| Monthly MACD Signal | Dead Cross | Bearish long-term momentum indicator |
| 21-Day Weekly MA | Bearish Divergence | Short-term selling pressure confirmed |
This downtrend matters for portfolio allocation over a 5-year horizon. Institutional liquidity cycles, as tracked by ETF flows, show slowing inflows. Retail market structure is fragmenting, with leveraged positions unwinding. Historical cycles suggest such phases precede major rallies, but they test investor patience. On-chain forensic data confirms increased coin movement to exchanges, indicating distribution.
, regulatory clarity from the SEC.gov on spot ETFs has not prevented technical deterioration. The Federal Reserve's interest rate policies continue to influence risk asset correlations. Market analysts warn that a break below $70,000 could trigger a gamma squeeze in options markets, amplifying volatility. This scenario mirrors 2022's post-LUNA collapse dynamics.
"The current market likely represents a potential value accumulation phase rather than the end of the entire crypto market cycle," said Eric Crown, per the CoinDesk interview. The CoinMarketBuzz Intelligence Desk synthesizes this as institutional capital waiting for clearer technical signals before re-entering.
Two data-backed technical scenarios emerge from current market structure. First, a bullish reversal requires holding above key moving averages. Second, a bearish continuation aligns with Crown's analysis. Historical patterns indicate sideways action often resolves with a directional break within 3-6 months.
The 12-month institutional outlook hinges on ETF flow resilience and macro conditions. If the downtrend holds, accumulation near $50,000 could set a base for the next halving cycle. Market structure suggests patience is key, as similar consolidations in 2019 led to 200% gains.

Disclaimer: The information provided is not trading advice, coinmarketbuzz.com holds no liability for any investments made based on the information provided on this page. We strongly recommend independent research and/or consultation with a qualified professional before making any investment decisions.
coinmarketbuzz.com leverages advanced AI technology to analyze market data. All content is fact-checked and reviewed by our editorial team to ensure accuracy and neutrality.


