Loading News...
Loading...
Loading News...

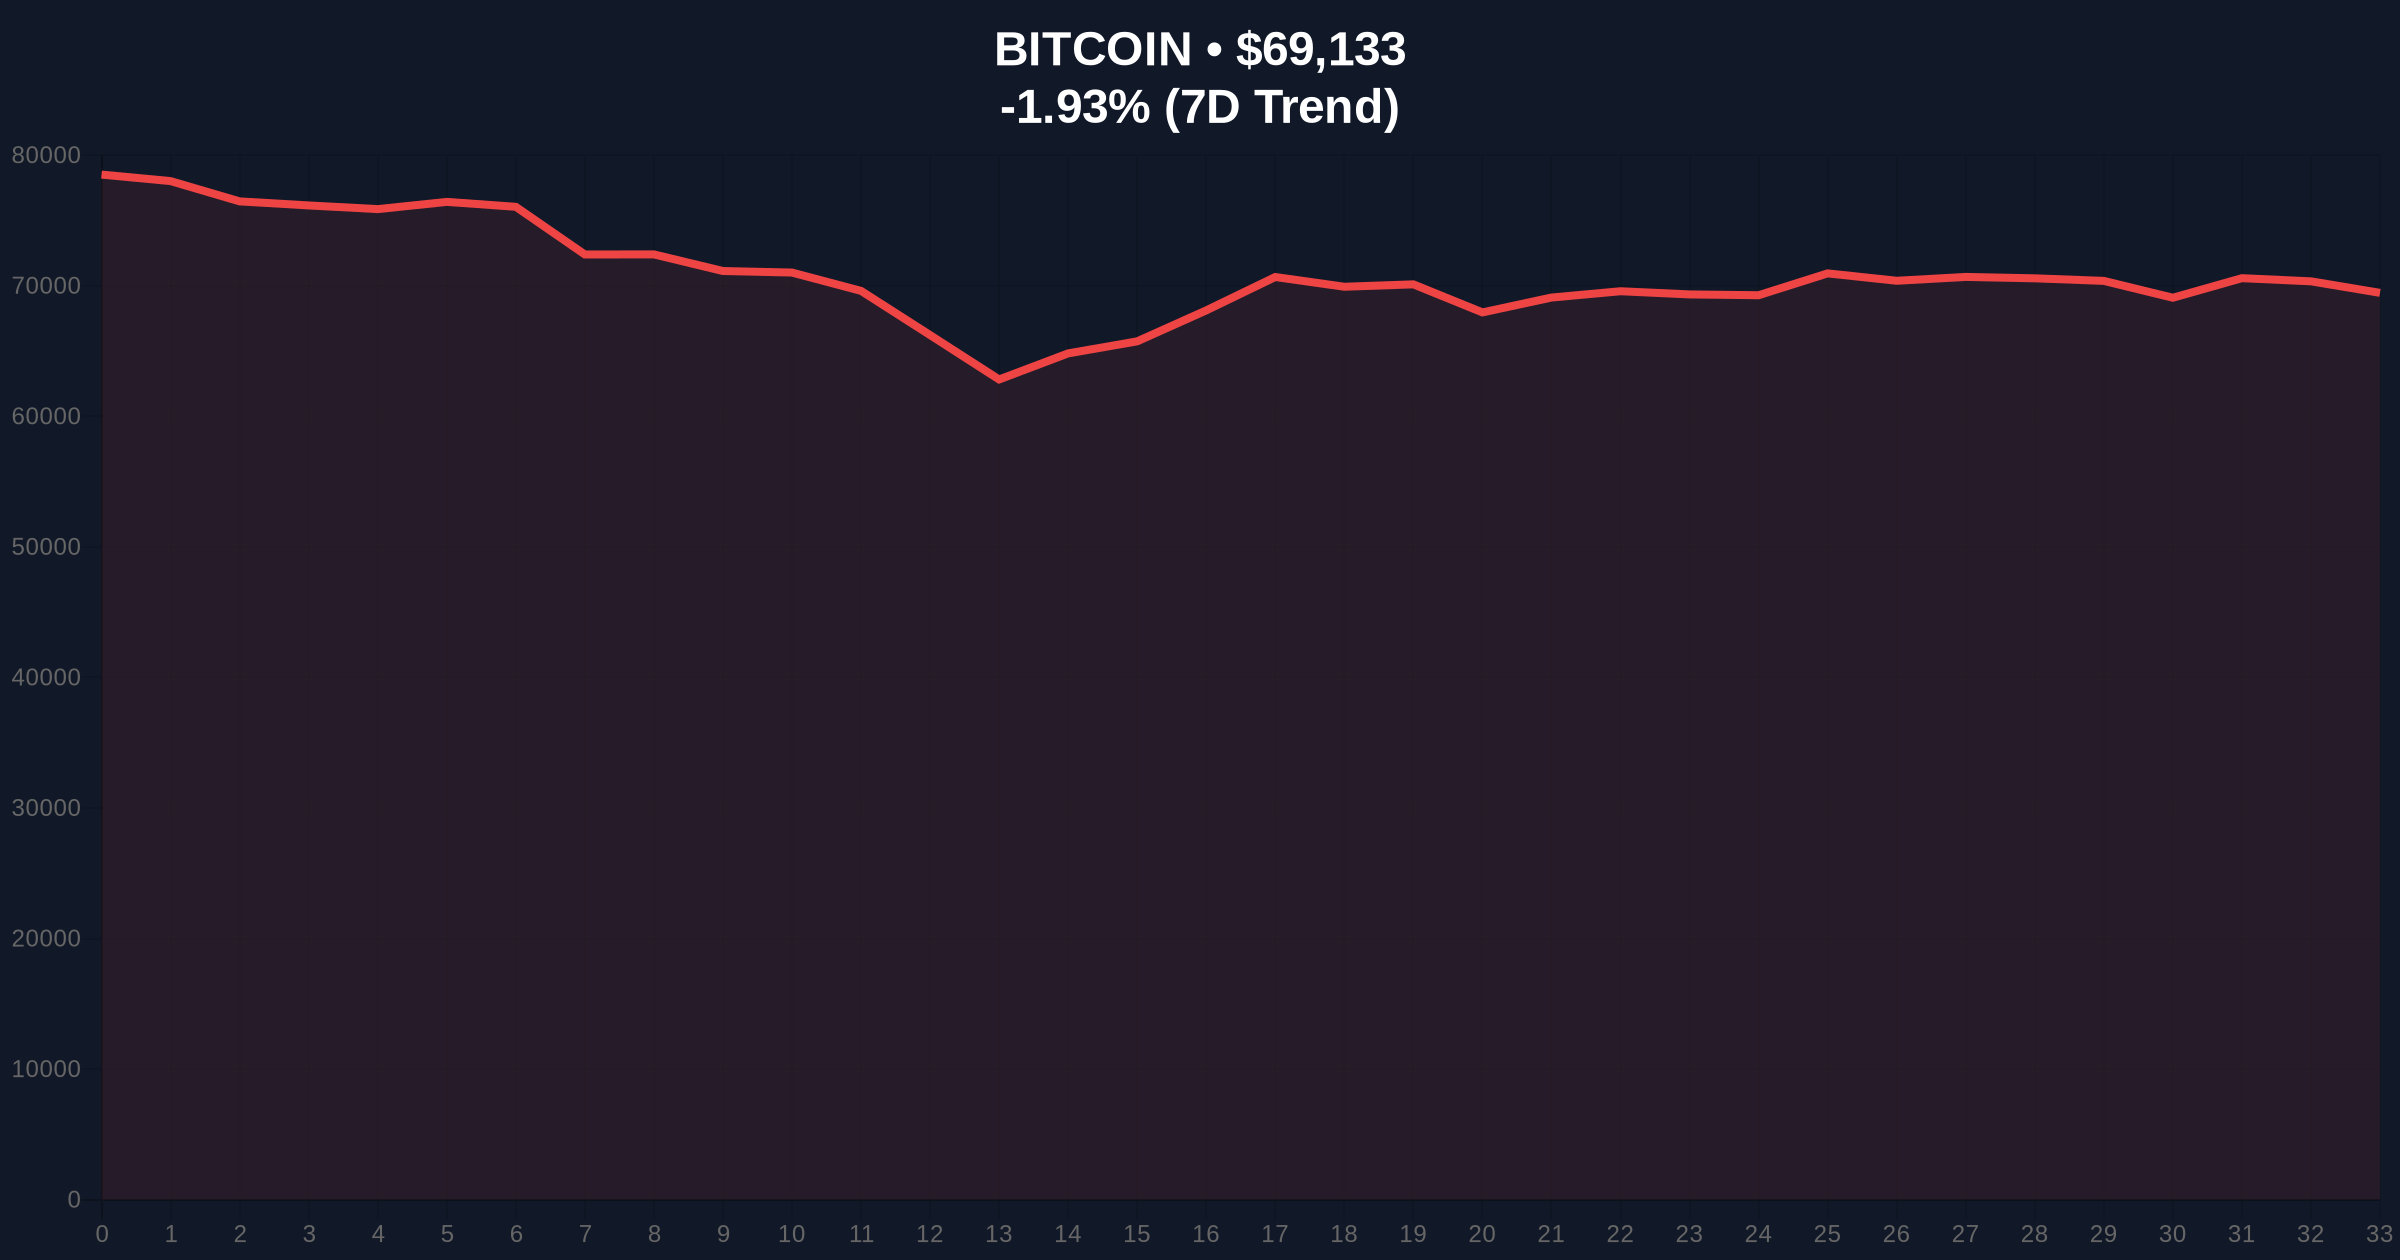
VADODARA, February 10, 2026 — Bitcoin faces mounting technical pressure as it sustains a critical breakdown below its 100-week moving average, triggering historical comparisons to previous extended bear cycles. This daily crypto analysis examines the structural implications of this technical breach and its potential impact on market liquidity.
Coin Bureau founder Nic Puckrin identified a critical technical development on social media platform X. According to his analysis, Bitcoin has closed below its 100-week moving average for three consecutive weeks, maintaining this position for 14 consecutive days. This represents a significant breach of long-term trend structure that historically precedes extended downturns.
Puckrin's historical analysis reveals concerning patterns. The average duration Bitcoin has spent below this critical moving average in previous cycles stands at 267 days. The shortest recorded period occurred during the 2020 COVID-19 crash at just 34 days. Market structure suggests the current breach could signal the beginning of a prolonged liquidity consolidation phase.
Historically, sustained breaks below the 100-week moving average have coincided with major bear market phases. The 2018-2019 cycle saw Bitcoin remain below this level for approximately 280 days, while the 2022 downturn maintained this position for over 200 days. Underlying this trend is a consistent pattern of institutional capital rotation and retail capitulation.
In contrast to previous cycles, current market conditions show diverging institutional behavior. While technical indicators signal bearish momentum, spot Bitcoin ETFs continue to demonstrate resilience. According to recent data, spot Bitcoin ETFs recorded $144.9 million in inflows despite extreme market fear, suggesting sophisticated capital positioning for longer time horizons.
The 100-week moving average currently sits at approximately $71,200, creating a significant Fair Value Gap between current price action and this critical level. Bitcoin's current price of $69,171 represents a 2.85% discount to this trendline, establishing what technical analysts term a "bearish order block."
Market structure suggests the Fibonacci 0.618 retracement level at $65,400 represents the next major support zone. This level corresponds with the 200-week moving average and historically significant volume nodes. The Relative Strength Index (RSI) on weekly charts currently reads 42, indicating neither oversold nor overbought conditions but trending toward bearish momentum.
| Metric | Value | Significance |
|---|---|---|
| Crypto Fear & Greed Index | 9/100 (Extreme Fear) | Indicates maximum retail capitulation |
| Bitcoin Current Price | $69,171 | 2.85% below 100W MA |
| 24-Hour Trend | -1.86% | Continuing bearish momentum |
| Days Below 100W MA | 14 | Sustained technical breakdown |
| Historical Average Below 100W MA | 267 days | Potential duration benchmark |
This technical development matters because the 100-week moving average represents institutional accumulation zones. Sustained breaks below this level typically trigger systematic selling from quantitative funds and algorithmic traders. Consequently, liquidity profiles shift dramatically as market makers adjust their inventory management strategies.
On-chain data indicates increased UTXO (Unspent Transaction Output) age band movement, with older coins beginning to transact at a higher rate. This suggests long-term holders are beginning to distribute, potentially creating additional supply pressure. The volume profile shows significant resistance clustering between $70,000 and $72,000, creating what technical analysts term a "liquidity vacuum" above current prices.
"While short-term rebounds are possible, the structural breakdown below the 100-week moving average creates significant headwinds for price recovery. Historical patterns suggest we may be in the early stages of a prolonged consolidation phase that could test lower support levels before establishing a new accumulation range."— CoinMarketBuzz Intelligence Desk
Market structure suggests two primary scenarios based on current technical positioning. The bearish scenario involves continued pressure toward the Fibonacci 0.618 support at $65,400, potentially testing the 200-week moving average. The bullish scenario requires reclaiming the 100-week moving average and establishing it as support, which would invalidate the current breakdown thesis.
The 12-month institutional outlook remains cautiously positioned. While technical indicators signal bearish momentum, fundamental developments like Ethereum ETF inflows of $57 million suggest broader crypto market infrastructure continues to mature. This creates a divergence between short-term price action and long-term adoption trends that sophisticated investors monitor closely.

Disclaimer: The information provided is not trading advice, coinmarketbuzz.com holds no liability for any investments made based on the information provided on this page. We strongly recommend independent research and/or consultation with a qualified professional before making any investment decisions.
coinmarketbuzz.com leverages advanced AI technology to analyze market data. All content is fact-checked and reviewed by our editorial team to ensure accuracy and neutrality.