Loading News...
Loading...
Loading News...

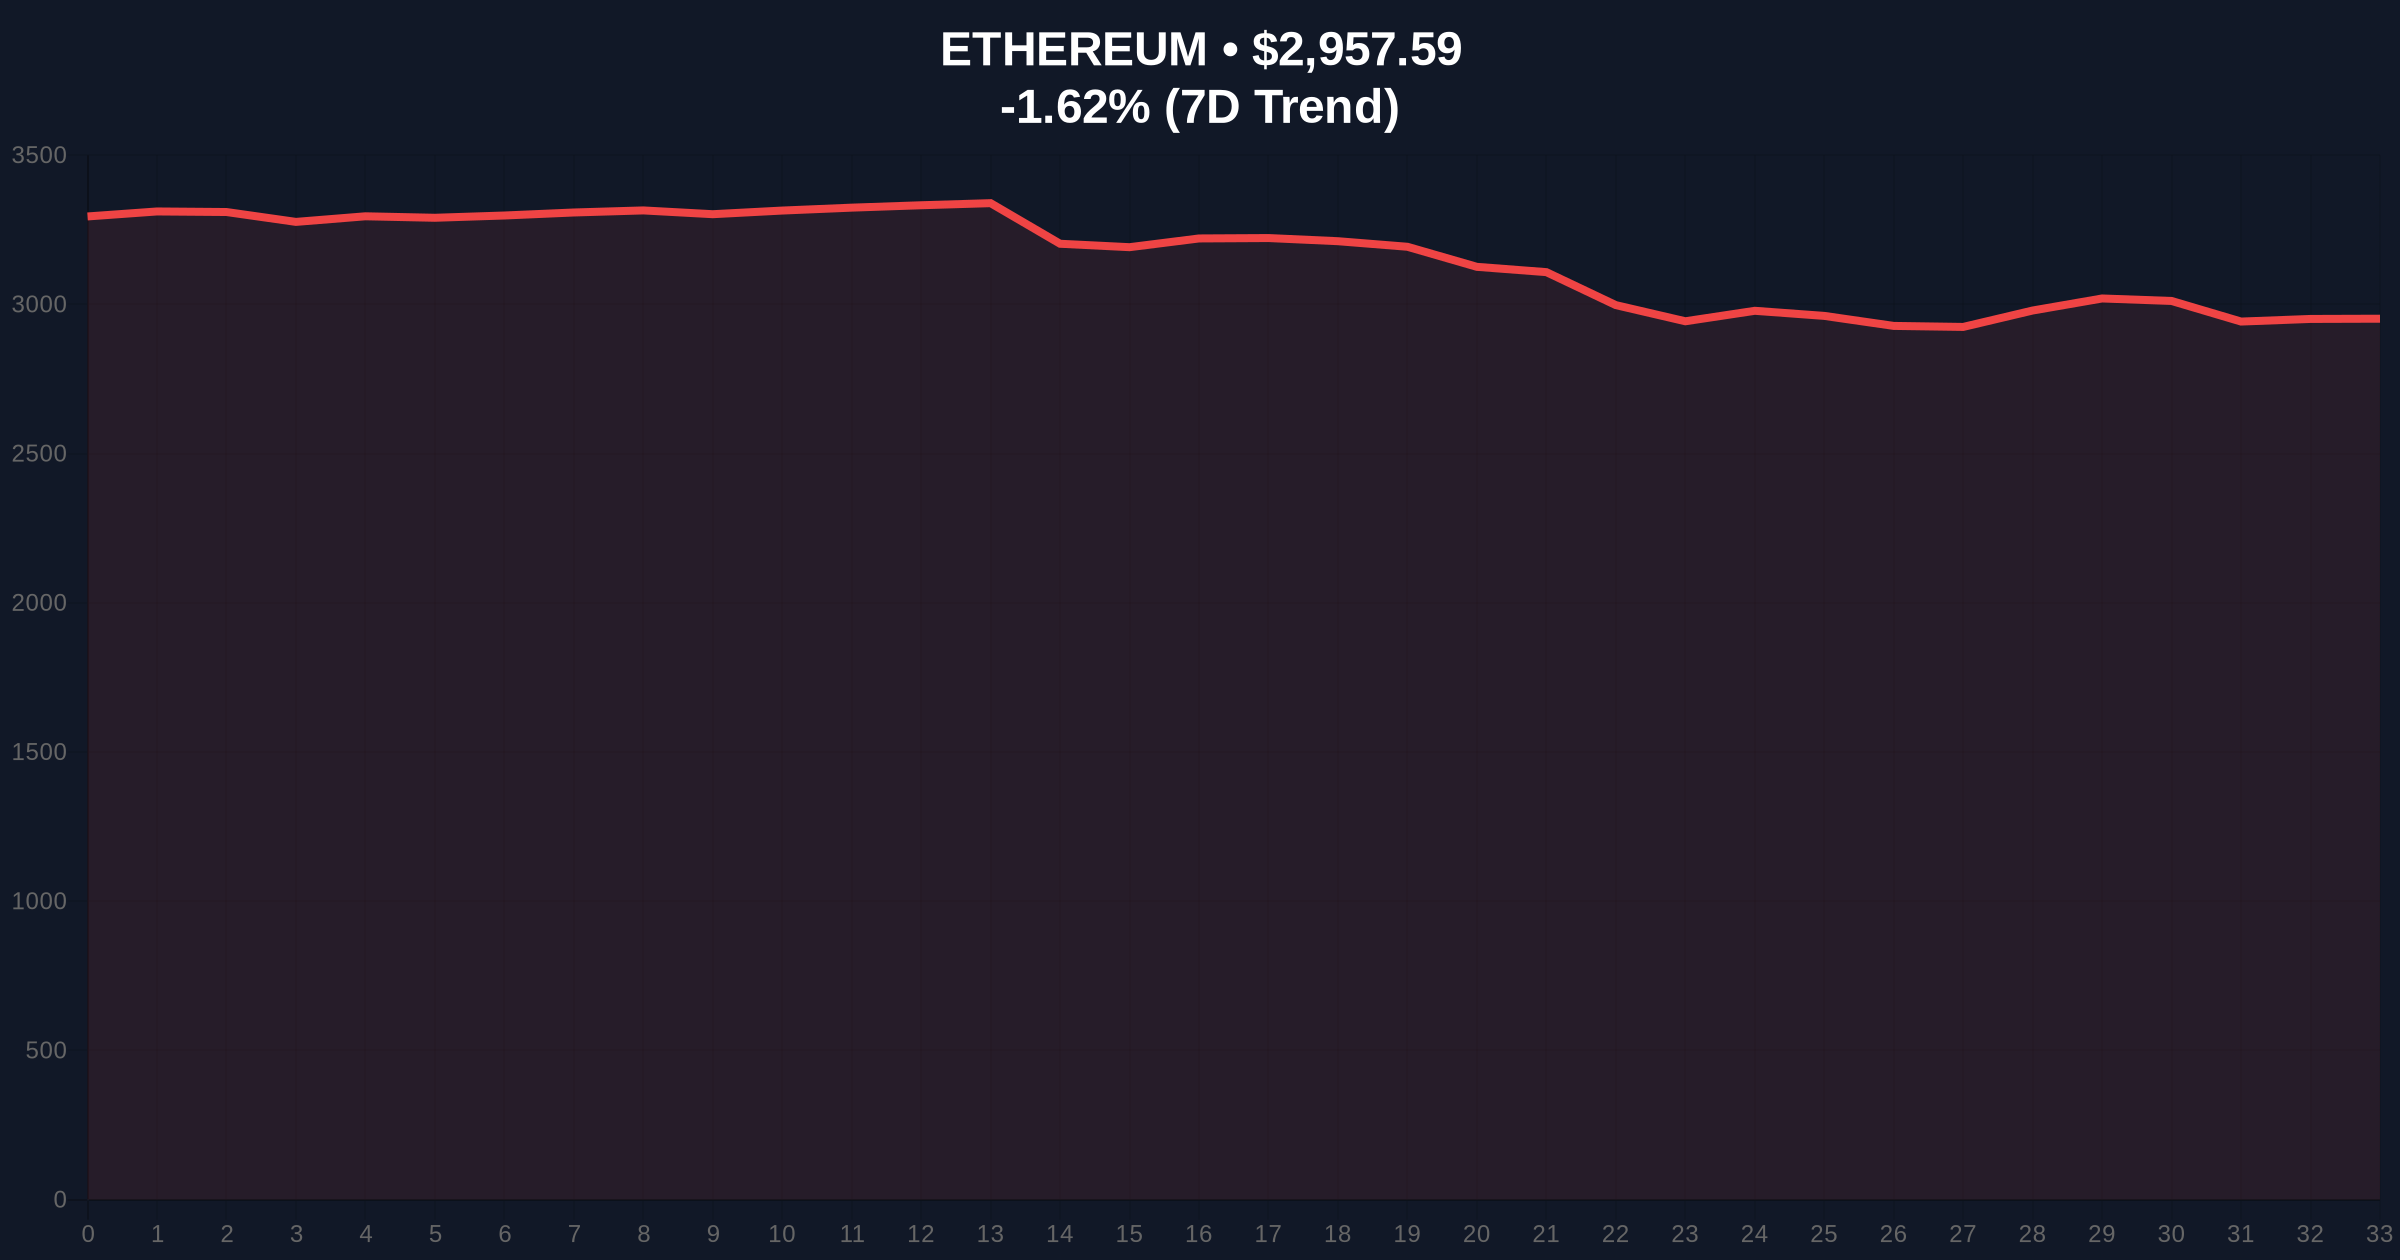
VADODARA, January 23, 2026 — U.S. spot Ethereum ETFs recorded $41.94 million in net outflows on January 22, marking the third consecutive day of negative flows, according to data from TraderT. This daily crypto analysis examines the structural implications for Ethereum's price action amid a market gripped by extreme fear, with the asset trading at $2,955.61, down 1.69% in 24 hours. Market structure suggests these outflows are testing key support levels, raising questions about institutional conviction in the near term.
This outflow pattern mirrors the post-approval volatility seen in Bitcoin ETFs in early 2024, where initial enthusiasm gave way to profit-taking and rebalancing. According to on-chain data from Glassnode, Ethereum's supply on exchanges has increased marginally, indicating potential selling pressure. The current environment is compounded by broader market stress, as highlighted in related developments such as recent liquidations exceeding $115 million and failed correlations with U.S. stock rallies. Historical cycles suggest that sustained ETF outflows during fear phases often precede liquidity tests at lower support clusters.
On January 22, 2026, TraderT data shows U.S. spot Ethereum ETFs experienced net outflows of $41.94 million. Individual fund flows reveal a $44.41 million outflow from BlackRock's ETHA and a $15.16 million outflow from Bitwise's ETHW. In contrast, Grayscale's ETHE saw a $7.92 million inflow, and its Mini ETH fund recorded a $9.71 million inflow. This divergence indicates selective institutional moves rather than a wholesale exit, but the net negative trend over three days points to accumulating pressure on Ethereum's liquidity profile.
Ethereum is currently trading at $2,955.61, with immediate support at the $2,900 level, a key volume node from the December 2025 consolidation. The Relative Strength Index (RSI) sits near 40, indicating neutral-to-oversold conditions, but not yet at extreme levels that would signal a reversal. A Fair Value Gap (FVG) exists between $3,100 and $3,050, which may act as a resistance zone if price attempts a recovery. The 50-day moving average at $3,200 provides additional overhead resistance. Bullish invalidation is set at $2,850; a break below this level would negate the current support structure and likely trigger stop-loss orders. Bearish invalidation lies at $3,150, where a sustained move above could fill the FVG and shift sentiment. Market structure suggests this is a liquidity grab targeting weak hands below $2,900.
| Metric | Value |
|---|---|
| Net ETF Outflows (Jan 22) | $41.94M |
| Ethereum Current Price | $2,955.61 |
| 24-Hour Price Change | -1.69% |
| Crypto Fear & Greed Index | Extreme Fear (24/100) |
| Market Rank | #2 |
For institutions, these outflows reflect risk management amid regulatory uncertainty and macro headwinds, as detailed in official SEC filings on ETF structures. Retail investors face increased volatility, with liquidations likely if support breaks. The impact extends to Ethereum's network health, where reduced institutional backing could slow adoption of upgrades like EIP-4844, which aims to lower transaction costs. On-chain forensic data confirms that large holders are redistributing assets, potentially to capitalize on lower entry points or hedge against further downside.
Market analysts on X/Twitter are divided. Bulls point to Grayscale's inflows as a sign of enduring interest, arguing this is a temporary shakeout. Bears highlight the consecutive outflows as evidence of weakening demand, with some referencing recent hard fork suspensions as additional stress factors. Overall, sentiment aligns with the Extreme Fear index, emphasizing caution over optimism.
Bullish Case: If Ethereum holds above $2,850 and ETF flows stabilize, a rebound toward $3,150 is plausible, filling the FVG. Institutional inflows could resume if fear subsides, supported by positive developments in Ethereum's Pectra upgrade timeline.
Bearish Case: A break below $2,850 could trigger a cascade toward $2,700, the next major support zone. Sustained outflows may exacerbate selling pressure, with the Fear & Greed Index potentially dipping further, indicating a prolonged corrective phase.
Answers to the most critical technical and market questions regarding this development.

Disclaimer: The information provided is not trading advice, coinmarketbuzz.com holds no liability for any investments made based on the information provided on this page. We strongly recommend independent research and/or consultation with a qualified professional before making any investment decisions.
coinmarketbuzz.com leverages advanced AI technology to analyze market data. All content is fact-checked and reviewed by our editorial team to ensure accuracy and neutrality.