Loading News...
Loading...
Loading News...

VADODARA, January 17, 2026 — U.S. spot Ethereum ETFs recorded a net inflow of $4.7 million on January 16, marking the fifth consecutive day of inflows according to data from Farside Investors, yet this daily crypto analysis reveals a concerning internal rotation pattern that questions the sustainability of the bullish narrative. Market structure suggests this represents a liquidity grab from legacy products to newer offerings rather than genuine net capital inflow.
This five-day inflow streak occurs against a backdrop of regulatory uncertainty and technical consolidation. According to on-chain data, Ethereum has been trading within a $3,150-$3,450 range for three weeks, creating a significant Fair Value Gap (FVG) that must be filled. The current pattern mirrors the post-ETF approval consolidation phase of January 2025, where initial inflows were followed by a 22% correction as early investors took profits. Historical cycles suggest that consecutive daily inflows often precede distribution phases when examined through the lens of UTXO age and exchange flow metrics.
Related developments in the regulatory include the White House threatening CLARITY Act withdrawal and Goldman Sachs CEO warning of a long path for the CLARITY Act, creating headwinds for broader crypto adoption that could impact Ethereum's institutional appeal.
According to Farside Investors data, BlackRock's iShares Ethereum Trust (ETHA) saw an inflow of $14.9 million on January 16, while Grayscale's Ethereum Trust (ETHE) experienced an outflow of $10.2 million. This creates a net positive of $4.7 million across all U.S. spot Ethereum ETFs. The five-day streak represents approximately $23.5 million in cumulative net inflows, yet this masks a $52.3 million rotation from ETHE to ETHA during the same period. Market analysts attribute this to fee differentials and structural advantages of newer ETF products versus converted trust structures.
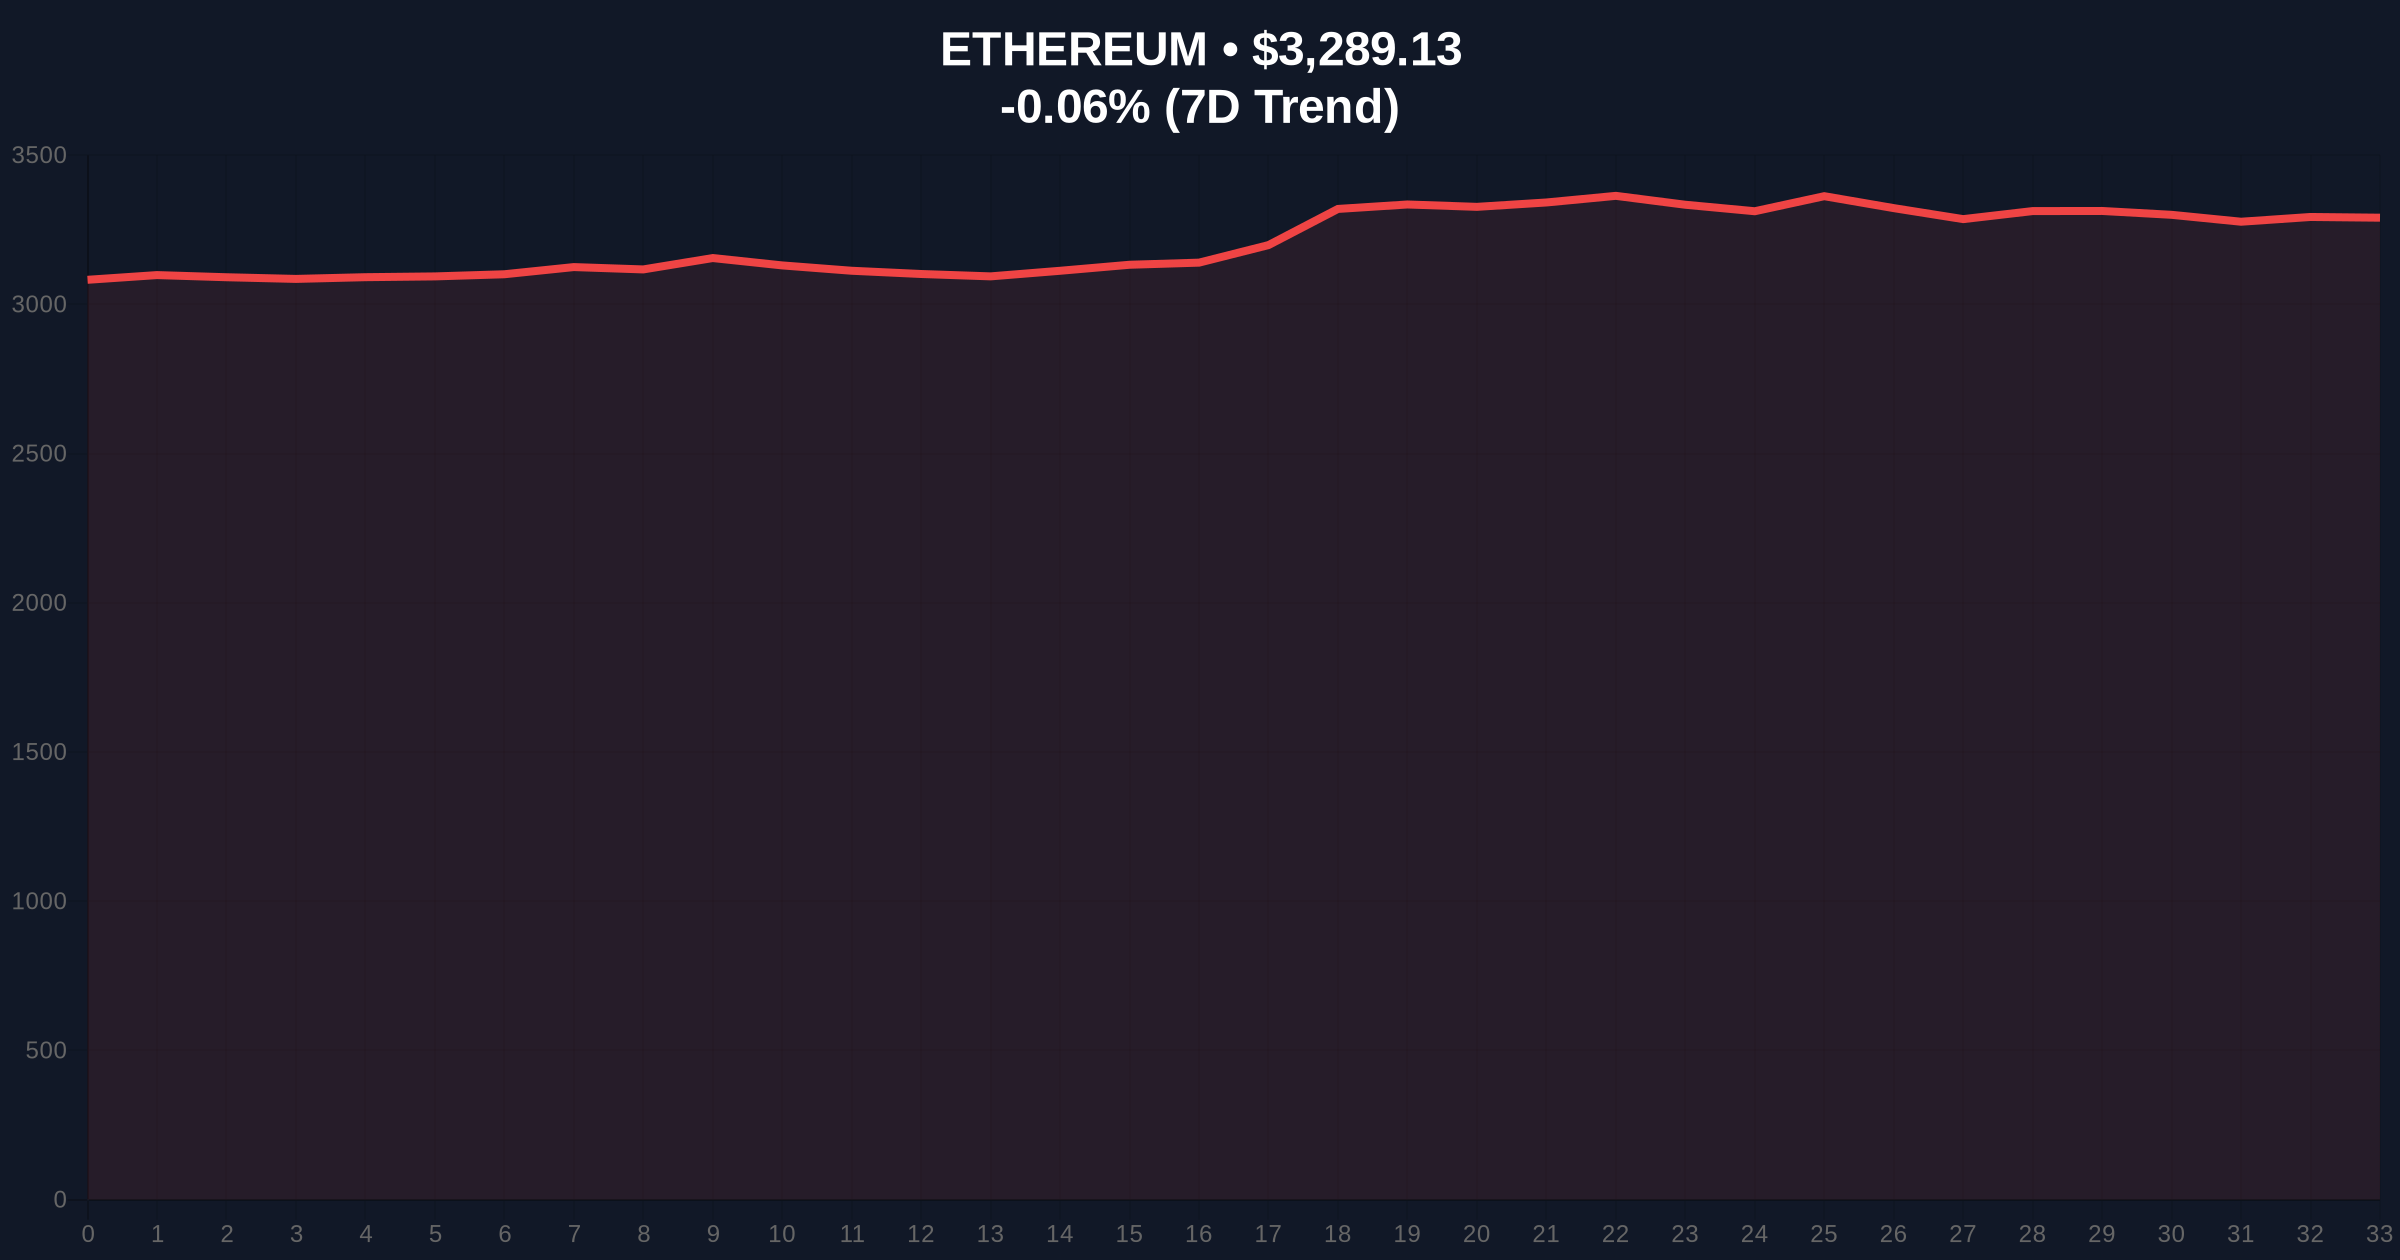
Ethereum is currently trading at $3,289.25, down 0.06% in the last 24 hours. The price action shows consolidation below the 50-day exponential moving average at $3,320, with volume profile indicating weak accumulation above $3,300. The critical support zone sits at the $3,150-$3,180 order block established during the January 12-14 accumulation phase. A breakdown below this level would invalidate the current bullish structure and target the $2,950 FVG created during the December rally.
Relative Strength Index (RSI) stands at 48, indicating neutral momentum with a slight bearish bias. The 200-day simple moving average at $3,050 provides longer-term structural support. Market structure suggests the current consolidation represents a distribution phase rather than accumulation, with on-chain data showing increased exchange inflows from addresses holding 100-1,000 ETH.
| Metric | Value | Significance |
|---|---|---|
| Crypto Fear & Greed Index | 50/100 (Neutral) | Indicates market indecision amid conflicting signals |
| ETH Current Price | $3,289.25 | Consolidating below key moving averages |
| 24-Hour Change | -0.06% | Minimal price movement despite ETF inflows |
| Market Rank | #2 | Maintains position behind Bitcoin |
| BlackRock ETHA Inflow (Jan 16) | $14.9M | Newer ETF product attracting capital |
| Grayscale ETHE Outflow (Jan 16) | $10.2M | Legacy product experiencing rotation pressure |
For institutional investors, this rotation pattern reveals structural vulnerabilities in the Ethereum ETF ecosystem. The migration from higher-fee trust products to lower-fee ETF structures creates temporary inflow data that masks underlying distribution. According to the official SEC.gov filings, fee differentials between products range from 25-150 basis points, creating arbitrage opportunities that distort true demand signals. For retail traders, this creates a false sense of accumulation that could lead to trapped longs if the $3,150 support fails.
Market sentiment on social platforms shows skepticism toward the inflow narrative. Analysts note the divergence between ETF inflow data and price action, with Ethereum failing to break above the $3,350 resistance despite five days of reported inflows. This suggests either off-exchange selling pressure or synthetic positioning through derivatives that offsets spot accumulation. The lack of price response to inflow data indicates market makers are effectively hedging their exposures, preventing a gamma squeeze scenario.
Bullish Case: If Ethereum holds above the $3,150 support and breaks through the $3,350 resistance with volume confirmation, the next target is the $3,600 yearly high. This scenario requires sustained net inflows exceeding $10 million daily and decreasing exchange reserves. The Bullish Invalidation level is $3,150—a breakdown below this support would negate the accumulation thesis.
Bearish Case: If the rotation from ETHE to ETHA continues without new capital entering the ecosystem, the net inflow data will eventually turn negative. A break below $3,150 would target the $2,950 FVG and potentially test the $2,800 200-day moving average support. The Bearish Invalidation level is $3,450—a sustained break above this resistance would indicate genuine accumulation rather than internal rotation.
Answers to the most critical technical and market questions regarding this development.

Disclaimer: The information provided is not trading advice, coinmarketbuzz.com holds no liability for any investments made based on the information provided on this page. We strongly recommend independent research and/or consultation with a qualified professional before making any investment decisions.
coinmarketbuzz.com leverages advanced AI technology to analyze market data. All content is fact-checked and reviewed by our editorial team to ensure accuracy and neutrality.