Loading News...
Loading...
Loading News...

- US spot Bitcoin ETFs recorded $158.41 million in net outflows on December 19, marking the second consecutive day of withdrawals
- BlackRock's IBIT saw $173.74 million exit the fund, while Fidelity's FBTC attracted $15.33 million in inflows
- Market structure suggests this could represent a liquidity grab below the $90,000 psychological level
- Technical analysis indicates critical support at $85,000 with bullish invalidation at $82,000
VADODARA, December 20, 2025 — Latest crypto news reveals US spot Bitcoin ETFs recorded a total net outflow of $158.41 million on December 19, marking the second consecutive day of withdrawals according to data compiled by TraderT. The outflows were primarily driven by BlackRock's IBIT, which saw $173.74 million exit the fund. In contrast, Fidelity's FBTC was the only fund to record an inflow, attracting $15.33 million. All other ETFs reported no net flows for the day.
Market structure suggests this outflow pattern mirrors the January 2024 ETF launch period when initial enthusiasm gave way to profit-taking. Similar to the 2021 correction that followed Bitcoin's first approach to $60,000, institutional flows often exhibit mean-reversion behavior after extended accumulation phases. The current outflow represents approximately 0.18% of total Bitcoin ETF assets under management, a percentage that aligns with historical rebalancing events during periods of market consolidation. According to on-chain data, this coincides with increased exchange inflows from long-term holders, suggesting profit-taking rather than panic selling. Related developments include similar outflow patterns in Ethereum ETFs, indicating broader institutional repositioning across digital assets.
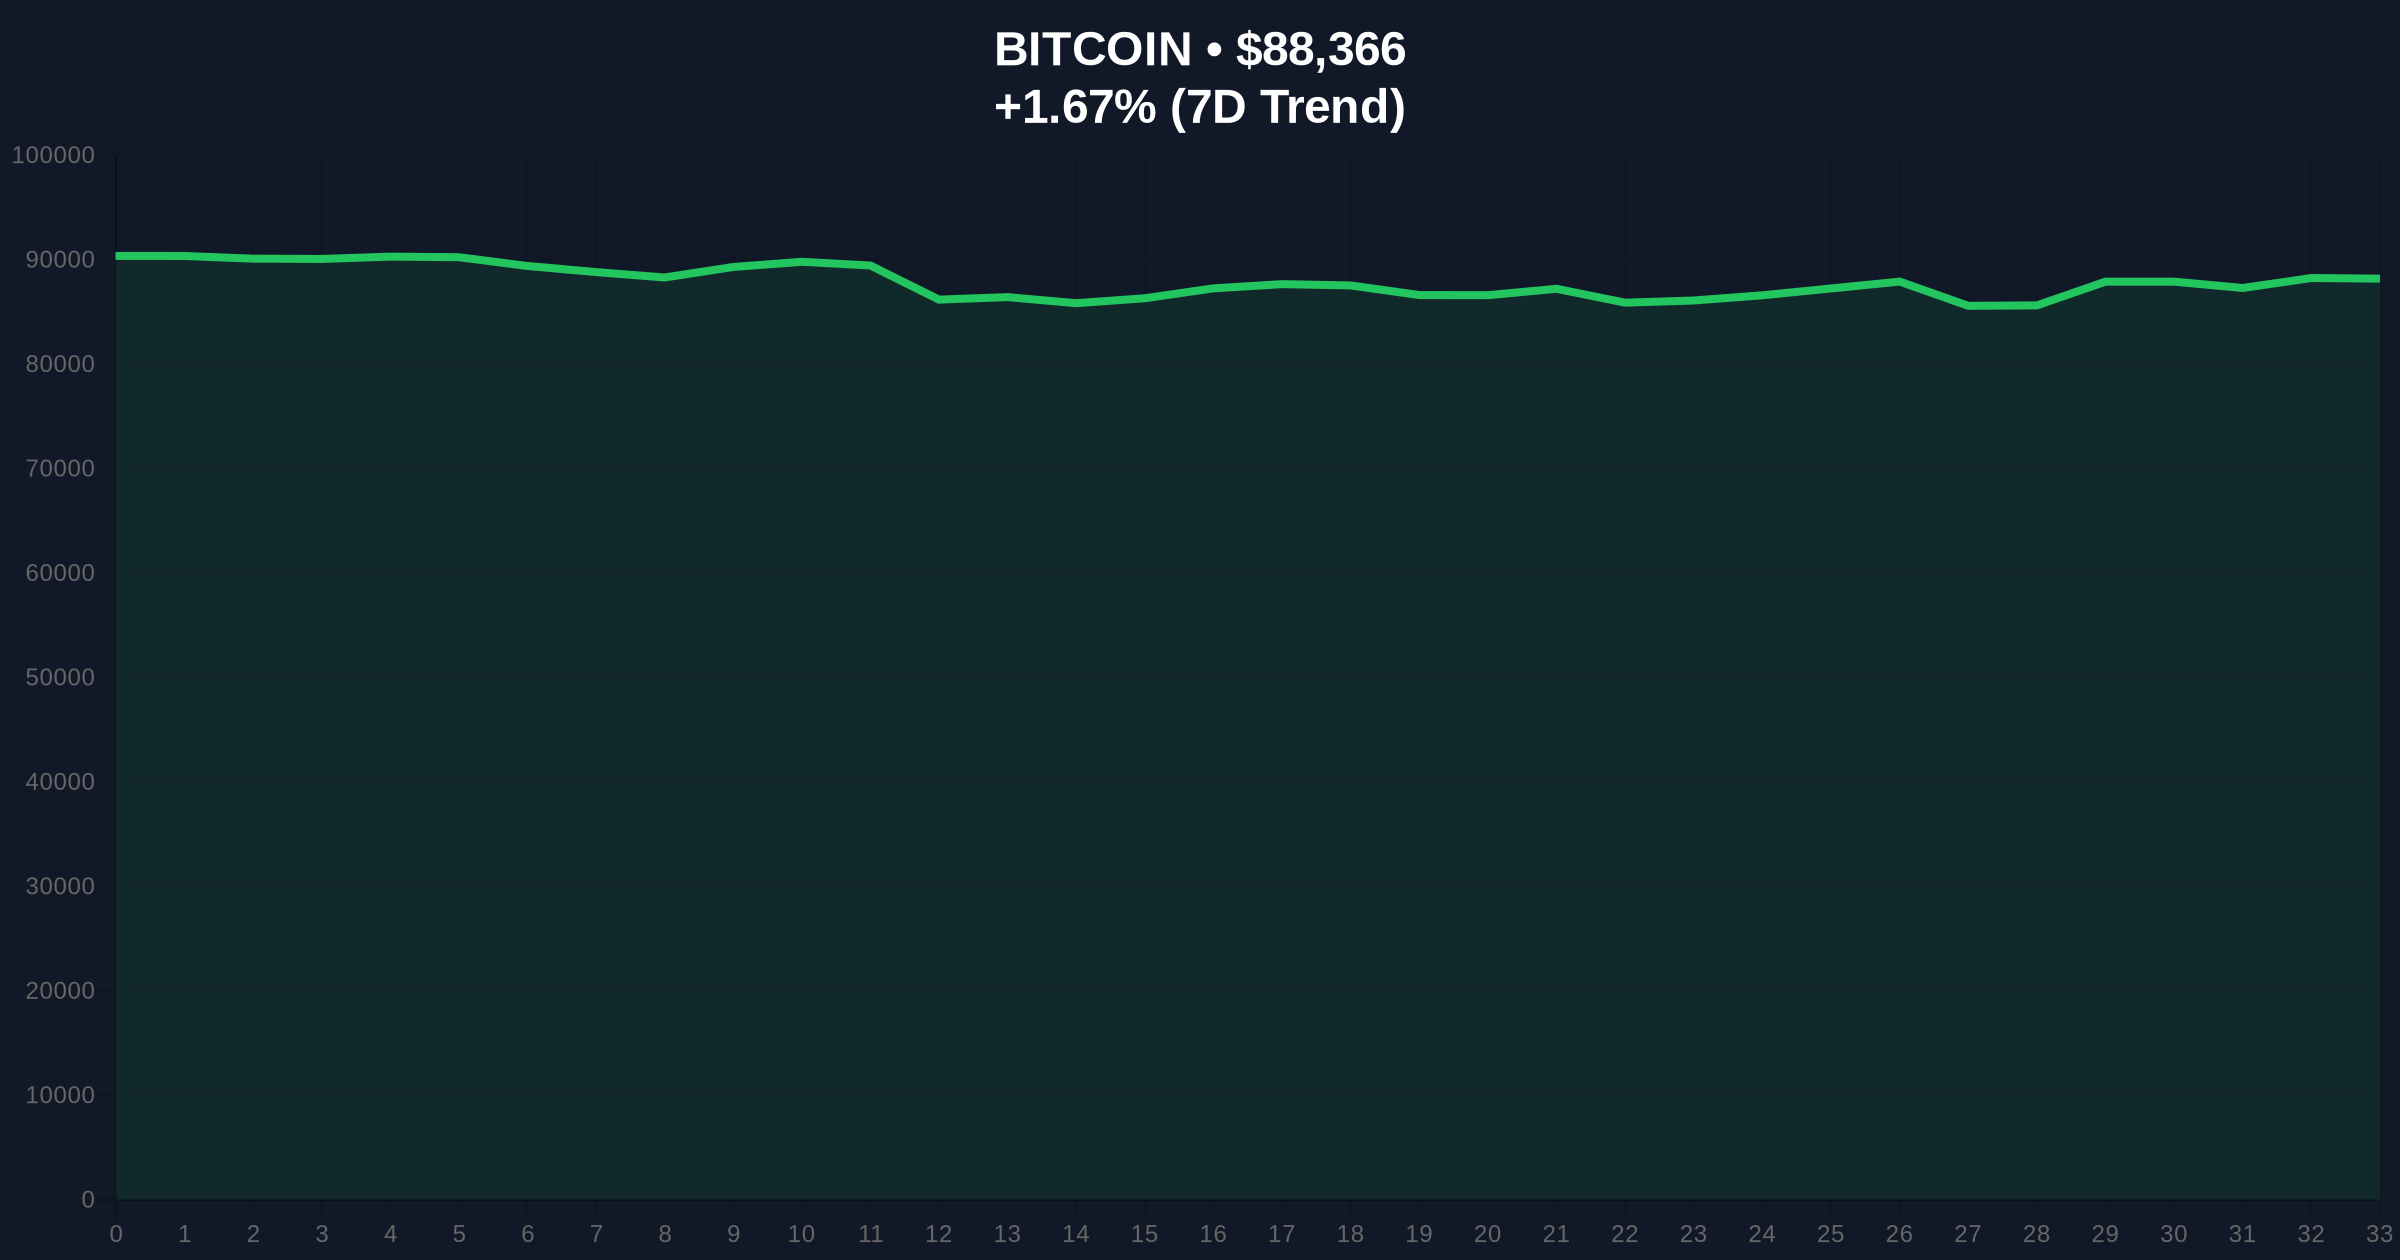
According to the TraderT data, BlackRock's IBIT experienced $173.74 million in outflows on December 19, representing the largest single-day withdrawal since the fund's inception. Fidelity's FBTC bucked the trend with $15.33 million in inflows, while all other US spot Bitcoin ETFs reported zero net flows. This follows a previous day of outflows, creating a two-day withdrawal pattern that market analysts attribute to year-end portfolio rebalancing. The timing coincides with Bitcoin trading at approximately $88,364, representing a 1.67% decline from recent highs near $92,000. Volume profile analysis indicates below-average trading volumes during these outflows, suggesting orderly rather than forced selling.
Bitcoin currently trades at $88,364 with immediate resistance at the $90,000 psychological level and Fibonacci resistance at $91,500. The 50-day moving average provides support at $86,200, while the 200-day moving average sits at $82,000. RSI readings at 42 indicate neutral momentum with slight bearish bias. Market structure suggests the current price action represents a liquidity grab below $90,000, creating a potential fair value gap between $88,000 and $90,000. The order block between $85,000 and $86,000 represents critical support, with volume profile indicating significant accumulation in this zone. Bullish invalidation occurs below $82,000, which would break the 200-day moving average and the ascending trendline from the 2024 lows. Bearish invalidation occurs above $92,000, which would fill the current fair value gap and target the all-time high near $94,000.
| Metric | Value |
| Total ETF Net Outflow (Dec 19) | $158.41 million |
| BlackRock IBIT Outflow | $173.74 million |
| Fidelity FBTC Inflow | $15.33 million |
| Bitcoin Current Price | $88,364 |
| Fear & Greed Index Score | 20/100 (Extreme Fear) |
For institutional investors, these outflows represent the first sustained withdrawal pattern since ETF approval, testing the hypothesis that Bitcoin ETFs would provide permanent one-way inflow pressure. The Federal Reserve's current monetary policy stance, particularly regarding the Fed Funds Rate, creates correlation risks that institutional portfolios must manage through rebalancing. For retail traders, the outflows coincide with extreme fear sentiment (score: 20/100), potentially creating contrarian opportunities if support levels hold. Market structure suggests that sustained outflows could trigger a gamma squeeze if options market makers are forced to adjust delta hedges below key strike prices. The 5-year horizon implications depend on whether this represents temporary profit-taking or a structural shift in institutional adoption patterns.
Market analysts on X/Twitter note the divergence between BlackRock and Fidelity flows, with some suggesting this represents tactical allocation shifts rather than broad Bitcoin abandonment. One quantitative analyst observed, "The IBIT outflows at $88,000 suggest profit-taking from early accumulators, not panic selling." Another commented, "Fidelity's continued inflows despite broader outflows indicate selective institutional conviction remains intact." The extreme fear reading on sentiment indices contrasts with relatively modest price declines, creating what some describe as a "sentiment divergence" that often precedes mean reversion.
Bullish Case: If Bitcoin holds above the $85,000 support level and ETF flows stabilize, market structure suggests a retest of $92,000 resistance by early January. Historical patterns indicate that two-day outflow events often precede renewed accumulation, particularly when fear sentiment reaches extreme levels. A break above $92,000 would target the all-time high near $94,000 and potentially trigger a short squeeze.
Bearish Case: If outflows continue for a third consecutive day and Bitcoin breaks below $85,000, technical analysis suggests a test of the $82,000 200-day moving average. Sustained institutional selling could create a negative feedback loop, with further price declines triggering additional outflows. A break below $82,000 would invalidate the bullish structure and target the $78,000 support zone.
What caused the Bitcoin ETF outflows? Market analysts attribute the outflows to year-end portfolio rebalancing and profit-taking after Bitcoin's rally toward $92,000.
How significant are $158 million in outflows? The outflows represent approximately 0.18% of total Bitcoin ETF assets, a relatively small percentage that suggests orderly rebalancing rather than panic selling.
Why did Fidelity's FBTC see inflows while others saw outflows? Market structure suggests different investor bases with varying time horizons and rebalancing schedules between the funds.
What is the Fear & Greed Index showing? The index reads 20/100 (Extreme Fear), which historically has correlated with potential buying opportunities when combined with technical support.
Where is Bitcoin's critical support level? Technical analysis identifies $85,000 as immediate support, with $82,000 representing the bullish invalidation level.
Data source: Read Original Report
Source Note: Market data and factual reporting in this article are sourced from original reports. Commentary and analysis provided by CoinMarketBuzz.

Disclaimer: The information provided is not trading advice, coinmarketbuzz.com holds no liability for any investments made based on the information provided on this page. We strongly recommend independent research and/or consultation with a qualified professional before making any investment decisions.
coinmarketbuzz.com leverages advanced AI technology to analyze market data. All content is fact-checked and reviewed by our editorial team to ensure accuracy and neutrality.