Loading News...
Loading...
Loading News...

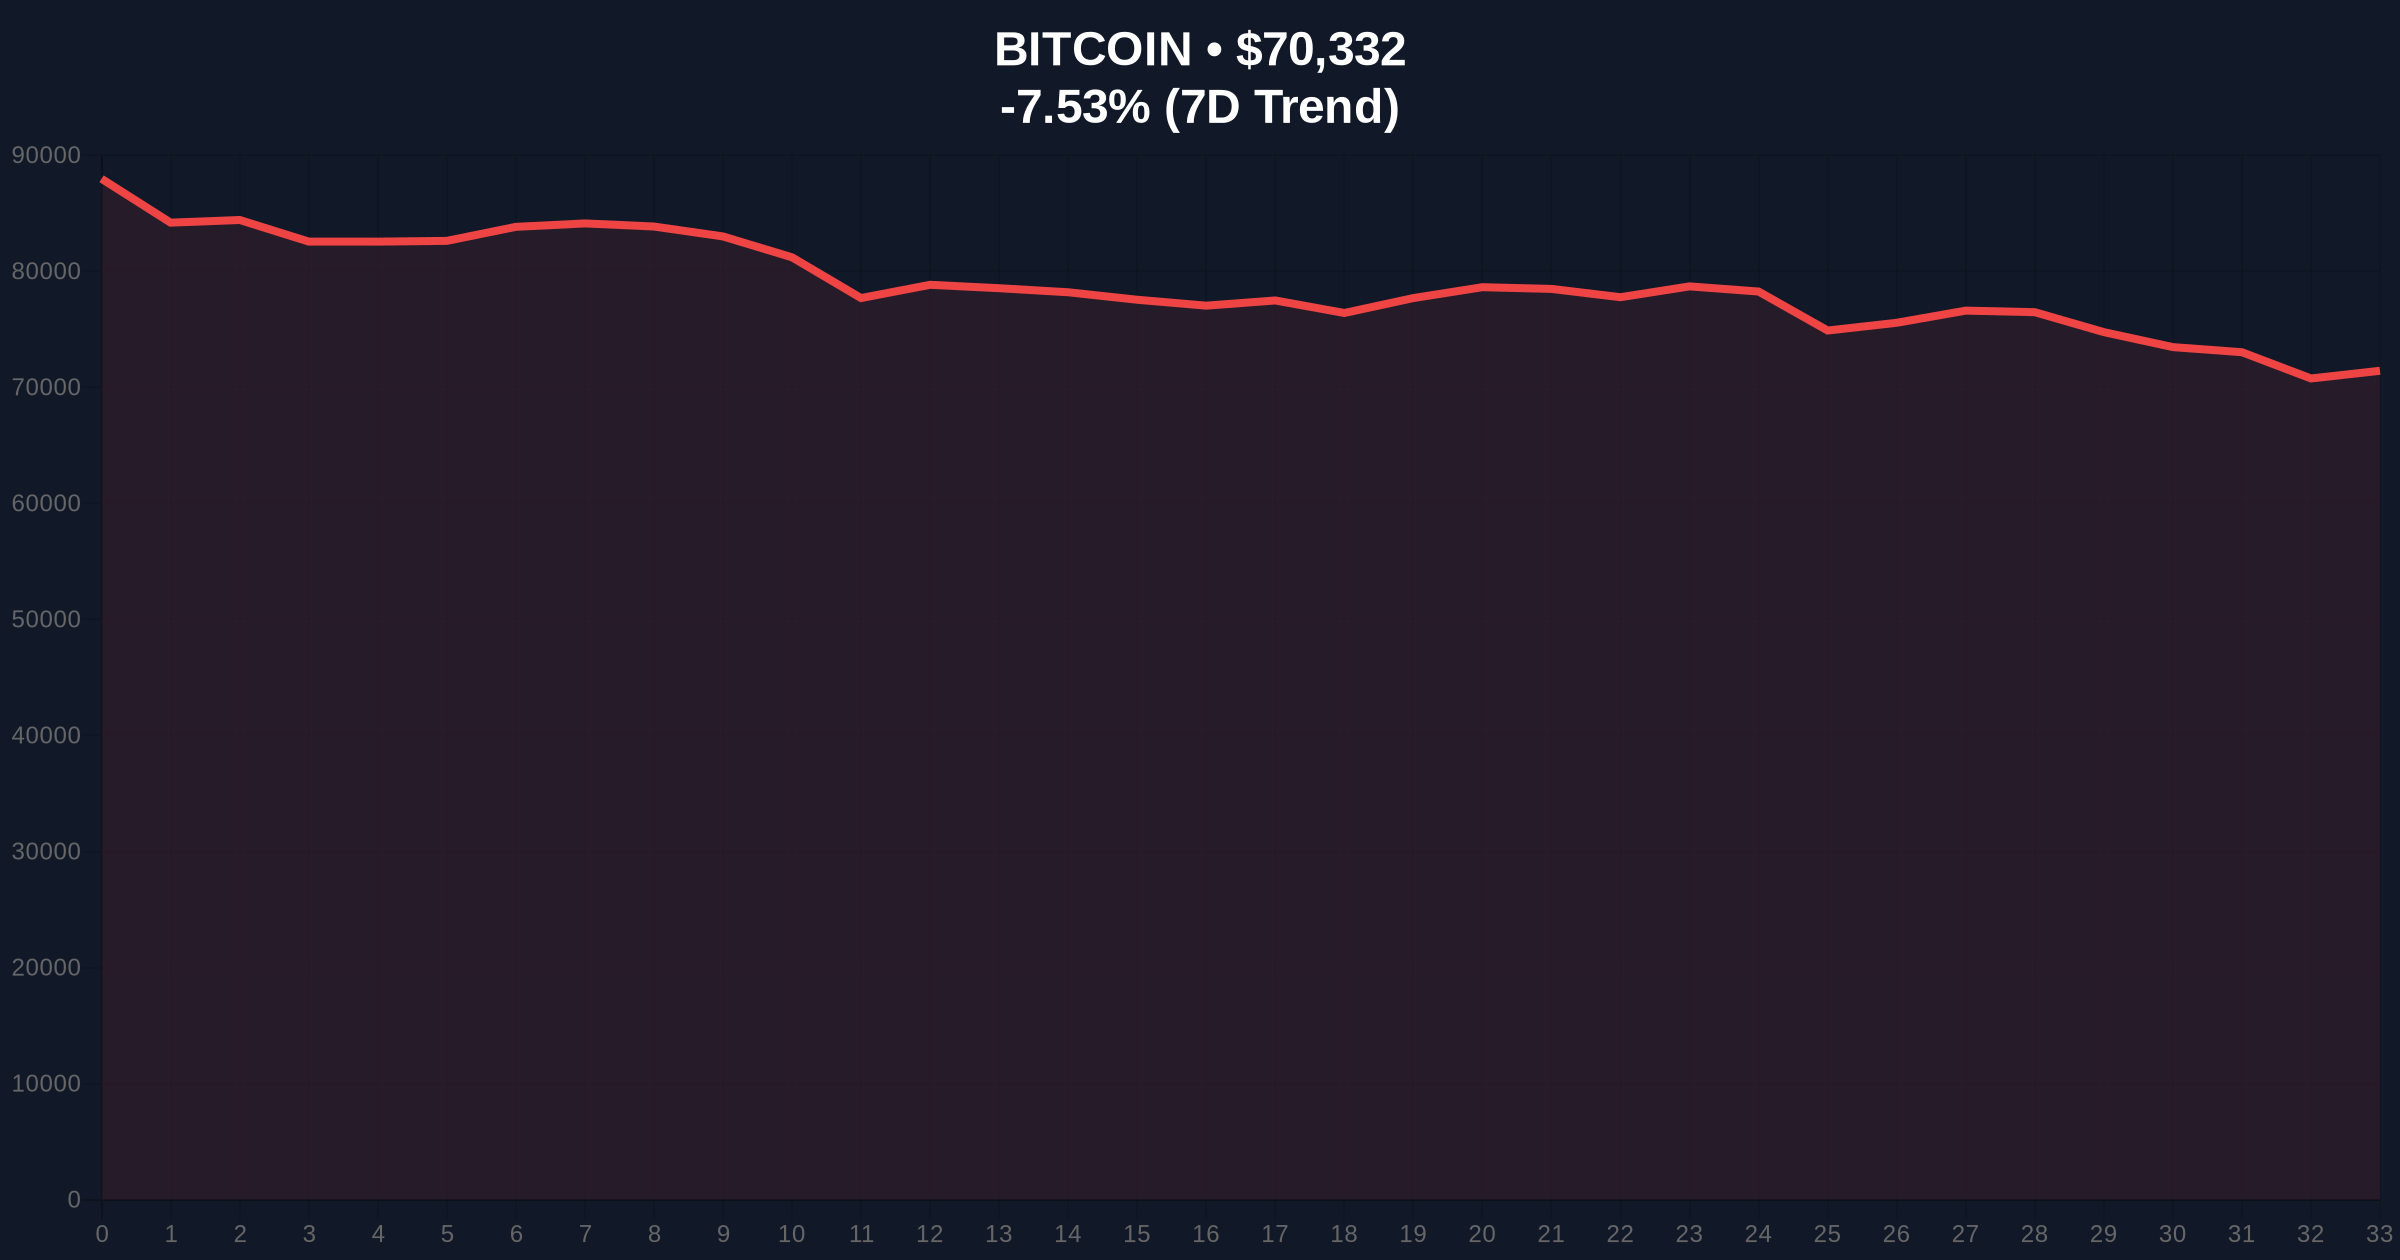
VADODARA, February 5, 2026 — Michael Burry, the investor famed for predicting the 2008 housing crash, has issued a stark warning that Bitcoin could repeat its 2022 bear market crash. According to a report by CoinDesk, Burry points to Bitcoin's drop from $126,000 in October 2025 to approximately $70,000 as a pattern mirroring the 2021-2022 downturn. This latest crypto news arrives as Bitcoin breaks below key psychological support, intensifying market fear.
CoinDesk's report details Burry's analytical framework. He compares the current price action to the 2022 bear market, where Bitcoin fell from around $35,000 to below $20,000. Applying this ratio to the current peak of $126,000 suggests a potential downside target in the low $50,000 range. Market structure suggests this warning coincides with a significant break in Bitcoin's weekly order block, creating a bearish Fair Value Gap (FVG) between $72,000 and $75,000.
On-chain data from Glassnode indicates rising exchange inflows, a classic sign of distribution. This activity aligns with Burry's cautionary stance. The warning has amplified existing negative sentiment, contributing to the -7.51% 24-hour price decline. Consequently, futures markets have seen elevated liquidations, a trend detailed in our analysis of recent crypto futures liquidations exceeding $100M hourly.
Historically, Bitcoin's bear markets exhibit fractal similarities. The 2018 cycle saw an -84% drawdown from peak to trough. In contrast, the 2022 correction was approximately -77%. The current drawdown from the $126,000 all-time high (ATH) to $70,352 represents a -44% decline. This is less severe than prior cycles but occurring over a compressed timeframe.
Underlying this trend is a critical macro divergence. The 2022 crash unfolded amid aggressive Federal Reserve rate hikes, detailed in official Federal Reserve meeting minutes. The current environment shows mixed signals, with potential rate cuts on the horizon. This fundamental disconnect makes a direct repeat less certain but does not invalidate the technical breakdown.
Related Developments:
The daily chart shows Bitcoin has broken below the 200-day simple moving average (SMA), a key institutional trend indicator. The Relative Strength Index (RSI) sits at 28, deep in oversold territory but not yet at the extreme lows seen in November 2022. Volume profile analysis reveals high-volume nodes near $68,500, establishing it as critical support.
Market structure suggests the next major Fibonacci support level lies at the 0.618 retracement of the 2023-2025 bull run, around $58,000. This aligns with Burry's projected low-$50,000 target zone. A breach of the $68,500 volume node would likely trigger a liquidity grab toward this level. The bearish invalidation for this scenario is a reclaim of the $75,000 FVG, which would fill the imbalance and suggest a false breakdown.
| Metric | Value | Context |
|---|---|---|
| Crypto Fear & Greed Index | 12/100 (Extreme Fear) | Lowest sentiment since June 2022. |
| Bitcoin (BTC) Price | $70,352 | Down 7.51% in 24h. |
| Drawdown from ATH ($126k) | -44% | Current cycle peak (Oct 2025). |
| Burry's Downside Target | Low $50,000s | Based on 2022 ratio projection. |
| Key Technical Support | $68,500 | High-volume node (Volume Profile). |
Burry's warning matters because it tests the market's structural integrity. A drop to the $50,000 range would represent a total market capitalization loss exceeding $500 billion. This would likely cause a gamma squeeze in options markets and force massive deleveraging across crypto derivatives. Institutional liquidity, which flowed in during the ETF approval phase, would face a severe stress test.
Retail market structure, often driven by leverage, would exacerbate the move. Historical cycles suggest such a crash would reset miner economics, potentially leading to hash rate declines and further sell pressure from mining entities. This creates a negative feedback loop that validates Burry's cautionary stance.
"The parallel to 2022 is not perfect, but the technical breakdown is undeniable. We are watching the $68.5k level as a line in the sand. A break there opens the path to $58k, the 0.618 Fib. This isn't about hype; it's about liquidity and order flow."— CoinMarketBuzz Intelligence Desk
Two primary data-backed scenarios emerge from current market structure.
The 12-month institutional outlook hinges on this support test. A hold above $68,500 could set the stage for a prolonged consolidation, similar to the 2019-2020 accumulation phase. A break lower likely extends the correction into Q3 2026, delaying the next halving cycle momentum. Long-term, the 5-year horizon remains tied to adoption metrics and regulatory clarity, but near-term price action will dictate capital flows.

Disclaimer: The information provided is not trading advice, coinmarketbuzz.com holds no liability for any investments made based on the information provided on this page. We strongly recommend independent research and/or consultation with a qualified professional before making any investment decisions.
coinmarketbuzz.com leverages advanced AI technology to analyze market data. All content is fact-checked and reviewed by our editorial team to ensure accuracy and neutrality.