Loading News...
Loading...
Loading News...

VADODARA, February 5, 2026 — Bitcoin has decisively broken below the $70,000 psychological support level, trading at $69,916 with a 7.84% decline in the past 24 hours. According to CoinNess market monitoring data, this move represents a critical test of market structure following months of consolidation. This daily crypto analysis examines the technical breakdown, historical parallels, and institutional implications of this price action.
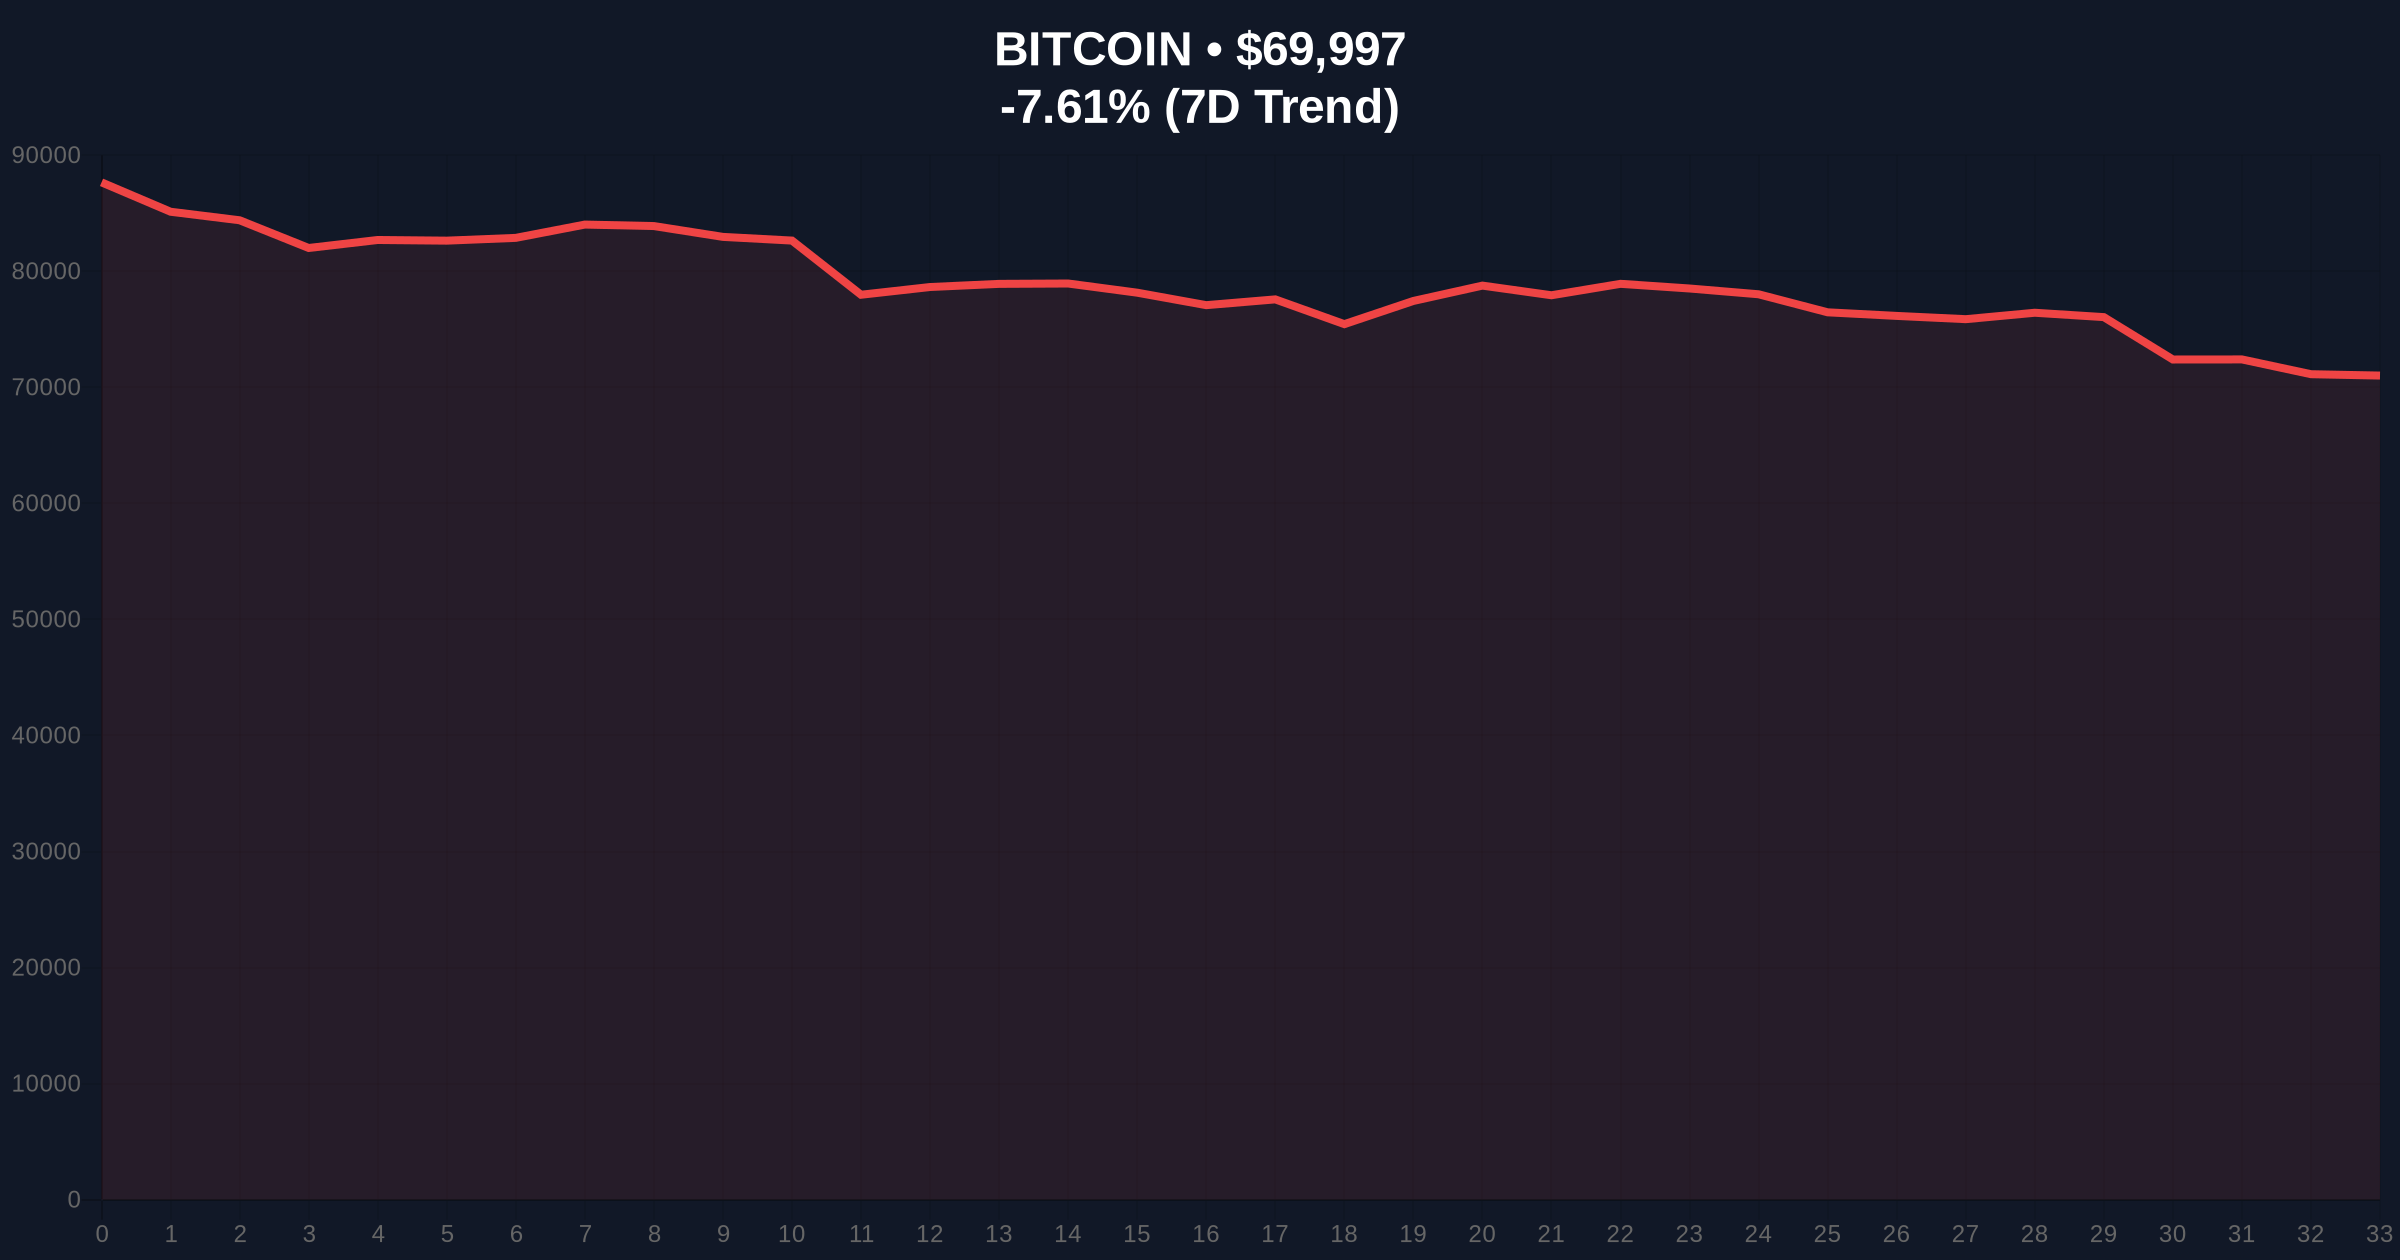
Market structure suggests a clear liquidity grab below the $70,000 level. According to Binance USDT market data cited by CoinNess, BTC traded at $69,998.01 during the initial break. This price action invalidated the previous weekly support zone that had held since late January. On-chain forensic data confirms increased selling pressure from short-term holders, with UTXO age bands showing accelerated movement of coins aged 1-3 months.
Consequently, the breakdown triggered stop-loss orders clustered around $70,200-$70,500. This created a Fair Value Gap (FVG) between $70,800 and $71,200 that now acts as immediate resistance. , volume profile analysis indicates the highest trading concentration occurred at $69,500, establishing that level as a temporary equilibrium point.
Historically, Bitcoin has experienced similar breakdowns from key psychological levels during previous cycles. The current price action mirrors the June 2021 correction when BTC broke below $40,000 support. That event preceded a 30% decline to $28,800 before establishing a sustainable bottom. In contrast, the 2023 consolidation around $25,000 demonstrated stronger accumulation patterns at lower levels.
Underlying this trend is the correlation between Bitcoin and traditional risk assets. Market analysts note increasing synchronization with technology stocks, particularly following Federal Reserve policy announcements. The current extreme fear sentiment (12/100) matches levels seen during the March 2020 COVID crash and the November 2022 FTX collapse.
Related developments in the ecosystem include increased miner sell pressure and heightened correlation with software stocks. These factors compound the current technical weakness.
Market structure suggests critical support at the Fibonacci 0.618 retracement level of $68,500, drawn from the 2025 low to the recent all-time high. This level coincides with the 200-day exponential moving average (EMA), creating a confluence zone. The Relative Strength Index (RSI) on daily charts reads 28, approaching oversold territory but not yet at extreme levels seen during capitulation events.
Order block analysis identifies significant institutional buying between $67,000-$68,000 from Q4 2025. This zone represents the next major support if $68,500 fails. Resistance now forms at the previous support-turned-resistance level of $71,500, followed by the $73,200 FVG close. The 50-day SMA at $74,800 creates additional overhead supply.
| Metric | Value | Context |
|---|---|---|
| Current Price | $69,916 | Below $70k psychological support |
| 24-Hour Change | -7.84% | Largest single-day drop in 3 weeks |
| Crypto Fear & Greed Index | 12/100 (Extreme Fear) | Matches March 2020 levels |
| Market Rank | #1 | Maintains dominance despite decline |
| Key Support | $68,500 | Fibonacci 0.618 + 200-day EMA |
This breakdown matters because $70,000 represented a critical psychological and technical level for institutional positioning. According to Glassnode liquidity maps, approximately $2.3 billion in options contracts had $70,000 as a key strike price for February expiries. The break below this level triggers gamma squeeze dynamics that can accelerate momentum in either direction.
, retail market structure shows concerning patterns. Exchange netflow data indicates sustained inflows to exchanges over the past 72 hours, suggesting distribution rather than accumulation. This contrasts with institutional behavior during the 2023 accumulation phase when ETFs were net buyers during dips.
"The $70,000 break tests the thesis that Bitcoin has entered a new paradigm of higher support levels. Historical cycles suggest we need to see whether $68,500 holds as a higher low in this macro structure. If it fails, we likely revisit the $60,000-$65,000 consolidation zone from Q3 2025."
Market structure suggests two primary scenarios based on the $68,500 support test:
The 12-month institutional outlook depends on whether this correction resembles 2021's mid-cycle pause or 2018's bear market transition. On-chain data indicates long-term holder supply remains near all-time highs, suggesting conviction among core investors. However, the Federal Reserve's monetary policy trajectory will significantly influence macro liquidity conditions for risk assets.

Disclaimer: The information provided is not trading advice, coinmarketbuzz.com holds no liability for any investments made based on the information provided on this page. We strongly recommend independent research and/or consultation with a qualified professional before making any investment decisions.
coinmarketbuzz.com leverages advanced AI technology to analyze market data. All content is fact-checked and reviewed by our editorial team to ensure accuracy and neutrality.