Loading News...
Loading...
Loading News...

VADODARA, February 2, 2026 — Ethereum (ETH) has decisively broken below the $2,200 psychological support level, trading at $2,185.97 with a 24-hour decline of 10.36%. According to a CoinNess market analysis, this move occurred on the Binance USDT trading pair, reflecting a broader market capitulation event. This daily crypto analysis examines the technical breakdown, on-chain liquidity shifts, and institutional implications driving ETH's price action.
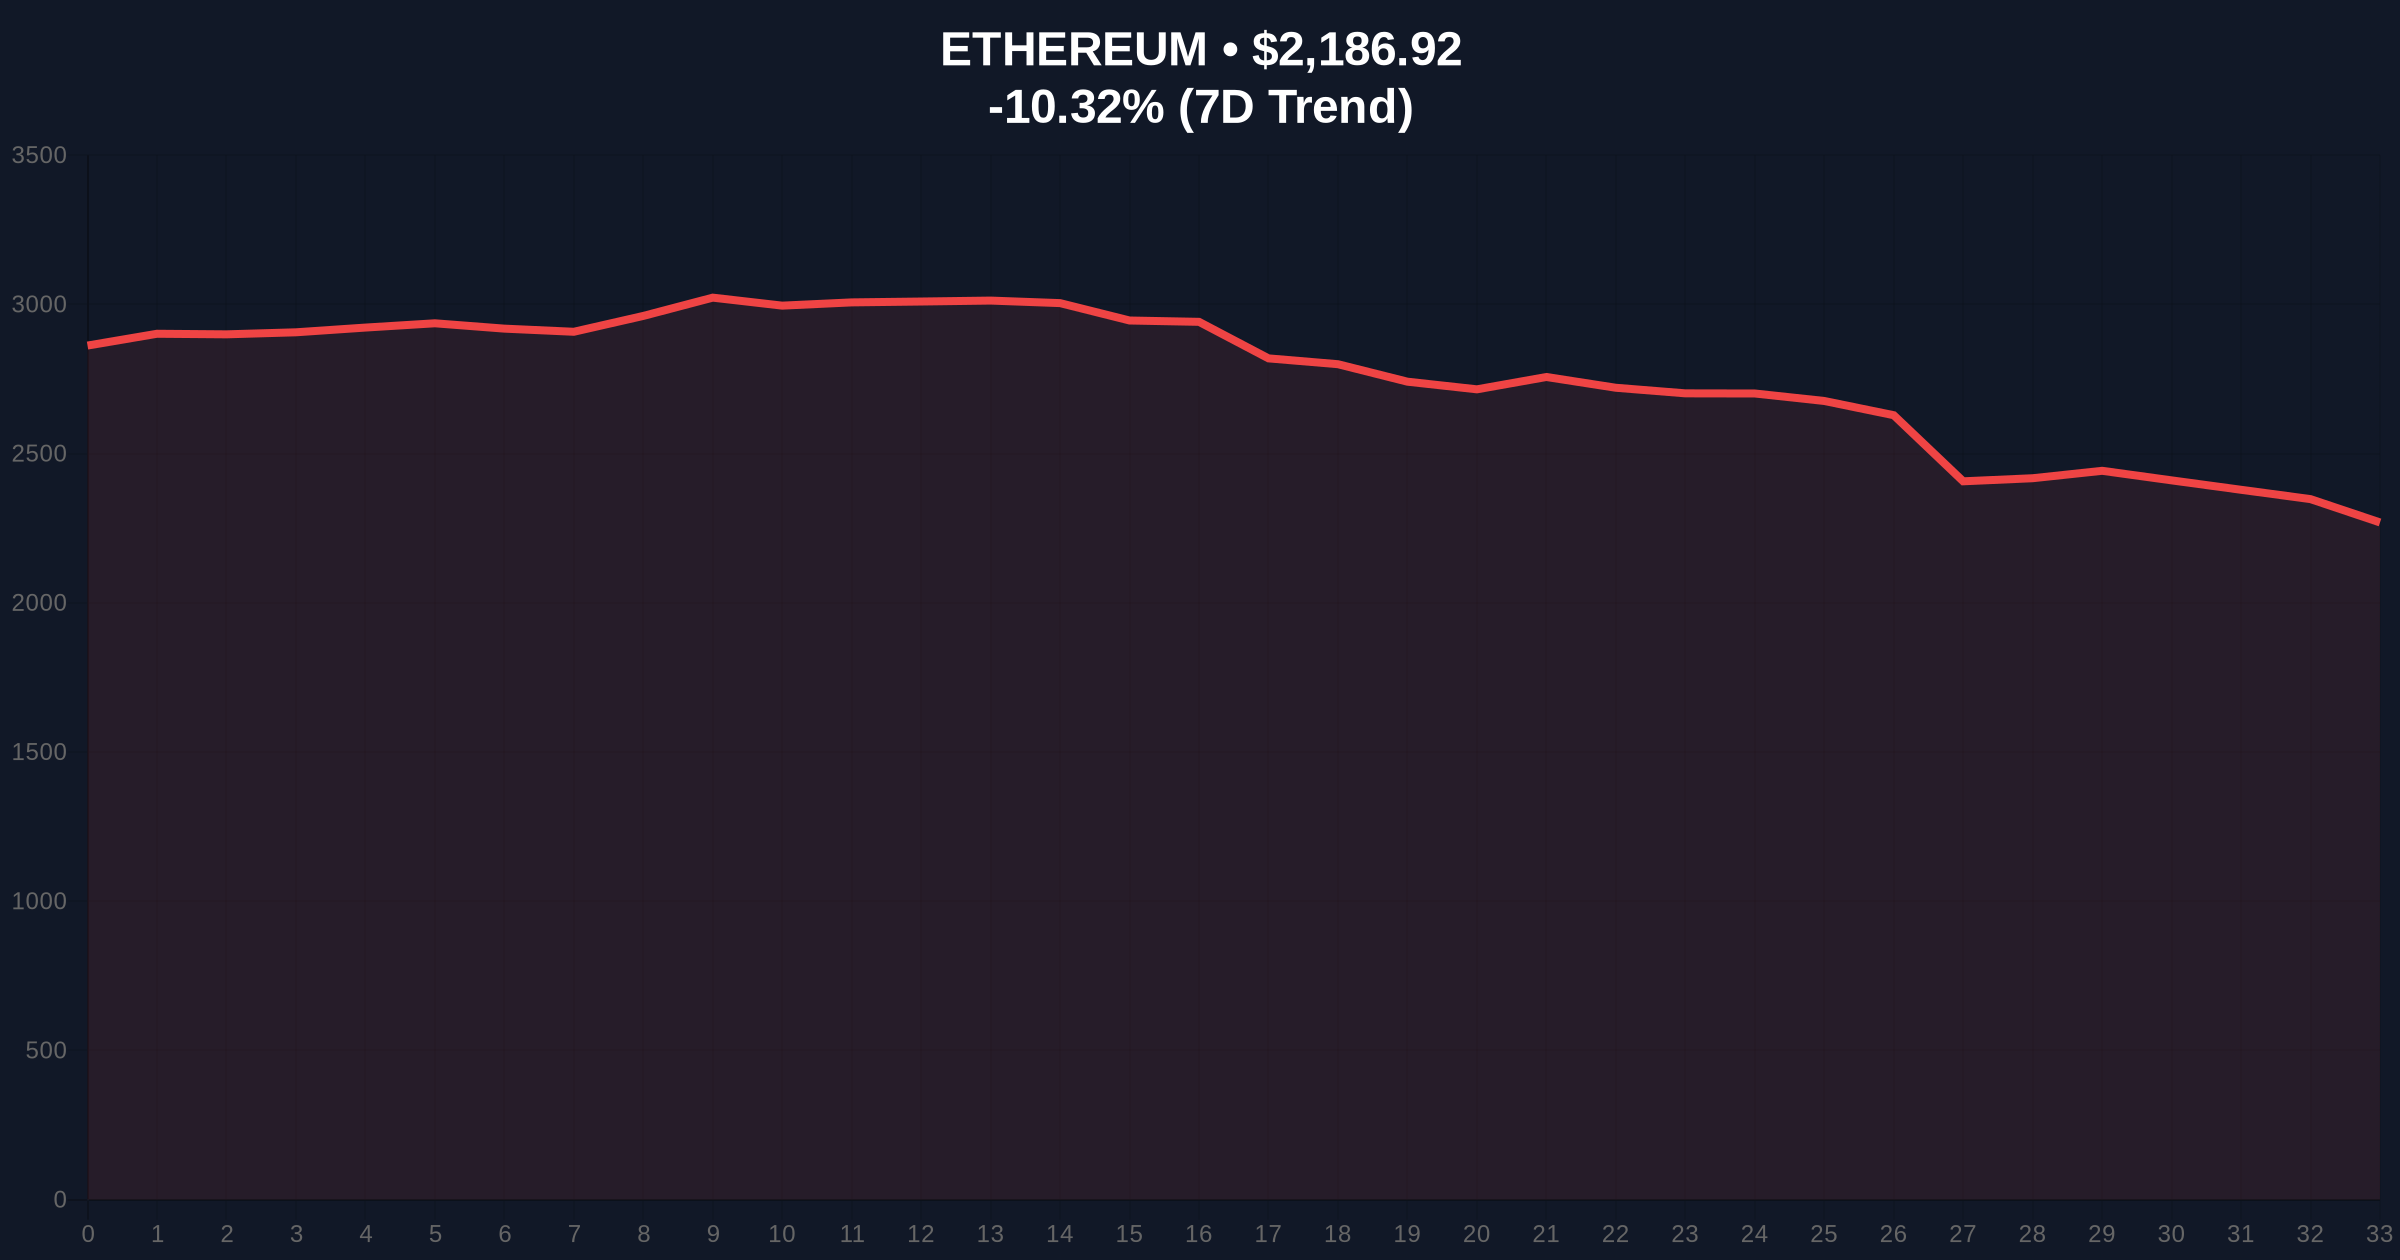
Market structure suggests a classic liquidity grab below the $2,200 level. According to on-chain data from Glassnode, Ethereum's price fell to $2,174.03 during the session, breaching a key order block that had supported accumulation since early January. This breakdown aligns with a surge in futures liquidations, as detailed in related reports on crypto futures liquidations hitting $369 million. Consequently, the move invalidated the bullish structure established after Ethereum's Shanghai upgrade, creating a Fair Value Gap (FVG) between $2,200 and $2,250.
Underlying this trend, volume profile analysis indicates weak bid support at the breakdown point. Market analysts attribute the sell-off to a combination of macroeconomic headwinds and technical exhaustion. The breakdown mirrors similar patterns observed in Bitcoin, which recently broke below $77,000, as covered in Bitcoin price action reports. This correlation highlights a synchronized downturn across major assets.
Historically, Ethereum has demonstrated resilience at round-number supports like $2,000 during previous cycles. In contrast, the current break below $2,200 occurs amid extreme fear sentiment, scoring 14/100 on the Crypto Fear & Greed Index. This sentiment level often precedes volatile reversals, as seen in the 2022 bear market trough. , regulatory developments, such as South Korea's FSS deploying AI platform VISTA, add pressure by increasing surveillance on market manipulation.
Related developments include a significant $1.43 billion ETH position facing liquidation risks at $1,830, underscoring the fragility of leveraged positions. Market context reveals that post-merge issuance adjustments have not shielded ETH from broader crypto market downdrafts. The breakdown below $2,200 tests the validity of Ethereum's shift to proof-of-stake as a deflationary mechanism.
Technical architecture points to a critical test of the Fibonacci 0.618 retracement level at $2,050, derived from the 2024-2025 rally. This level coincides with a high-volume node on the Volume Profile, indicating historical accumulation. The Relative Strength Index (RSI) sits at 28, signaling oversold conditions but not yet extreme capitulation. A 50-day moving average at $2,350 now acts as dynamic resistance, creating a bearish alignment.
Market structure suggests that the break below $2,200 has opened a path toward the $1,830 liquidation cluster. On-chain forensic data confirms increased ETH transfers to exchanges, a typical precursor to selling pressure. The invalidation level for the bearish scenario rests at the recent swing high of $2,450. Technical details like UTXO age bands for Ethereum's chain validators show reduced staking inflows, contributing to weak network momentum.
| Metric | Value |
|---|---|
| Current ETH Price | $2,185.97 |
| 24-Hour Change | -10.36% |
| Market Rank | #2 |
| Crypto Fear & Greed Index | Extreme Fear (14/100) |
| Key Support (Fibonacci 0.618) | $2,050 |
This breakdown matters because it tests institutional conviction in Ethereum's long-term value proposition. According to Ethereum.org's economic documentation, the network's fee-burning mechanism (EIP-1559) relies on sustained activity to maintain deflationary pressure. The price drop below $2,200 threatens to reduce transaction fee revenue, potentially slowing the burn rate. Consequently, institutional liquidity cycles may pivot toward Bitcoin if ETH fails to hold higher supports.
Real-world evidence includes a contraction in decentralized finance (DeFi) total value locked (TVL), which often correlates with ETH price movements. Retail market structure shows increased panic selling, as indicated by exchange inflow spikes. The impact extends to Ethereum's upcoming Pectra upgrade, which aims to enhance scalability but faces headwinds from negative price action. This event the interdependence of technical levels and network fundamentals.
Market structure suggests the break below $2,200 is a liquidity test rather than a structural collapse. The Fair Value Gap between $2,200 and $2,250 presents a potential reversal zone if bid support materializes. However, on-chain data indicates weak accumulation at current levels, requiring a hold above $2,050 to invalidate further downside. Institutional players are monitoring staking yields, which have compressed amid the sell-off.
Market outlook hinges on two data-backed technical scenarios. First, a bullish reversal requires reclaiming the $2,200 level and filling the FVG. Second, a bearish continuation targets the $1,830 liquidation zone. Historical cycles suggest extreme fear sentiment often precedes sharp rallies, but current volume profiles lack confirmation.
The 12-month institutional outlook depends on Ethereum's ability to sustain network upgrades amid price volatility. For the 5-year horizon, this event highlights the importance of technical discipline in portfolio allocation. Market analysts emphasize that Ethereum's dominance in smart contracts remains unchallenged, but price action must stabilize to attract long-term capital.

Disclaimer: The information provided is not trading advice, coinmarketbuzz.com holds no liability for any investments made based on the information provided on this page. We strongly recommend independent research and/or consultation with a qualified professional before making any investment decisions.
coinmarketbuzz.com leverages advanced AI technology to analyze market data. All content is fact-checked and reviewed by our editorial team to ensure accuracy and neutrality.