Loading News...
Loading...
Loading News...

VADODARA, February 5, 2026 — Quantitative analytics firm CryptoQuant has published a stark assessment of Bitcoin's current market structure, indicating the ongoing bear phase exhibits more negative momentum than the 2022 downturn. This daily crypto analysis reveals Bitcoin has fallen 23% in approximately 83 days since breaking below its 365-day moving average in November 2025, compared to just a 6% decline over the same timeframe in the previous cycle. According to CryptoQuant, this acceleration signals rapidly deteriorating downward momentum, with BTC losing critical technical support and potentially targeting a retest of the $60,000-$70,000 range.
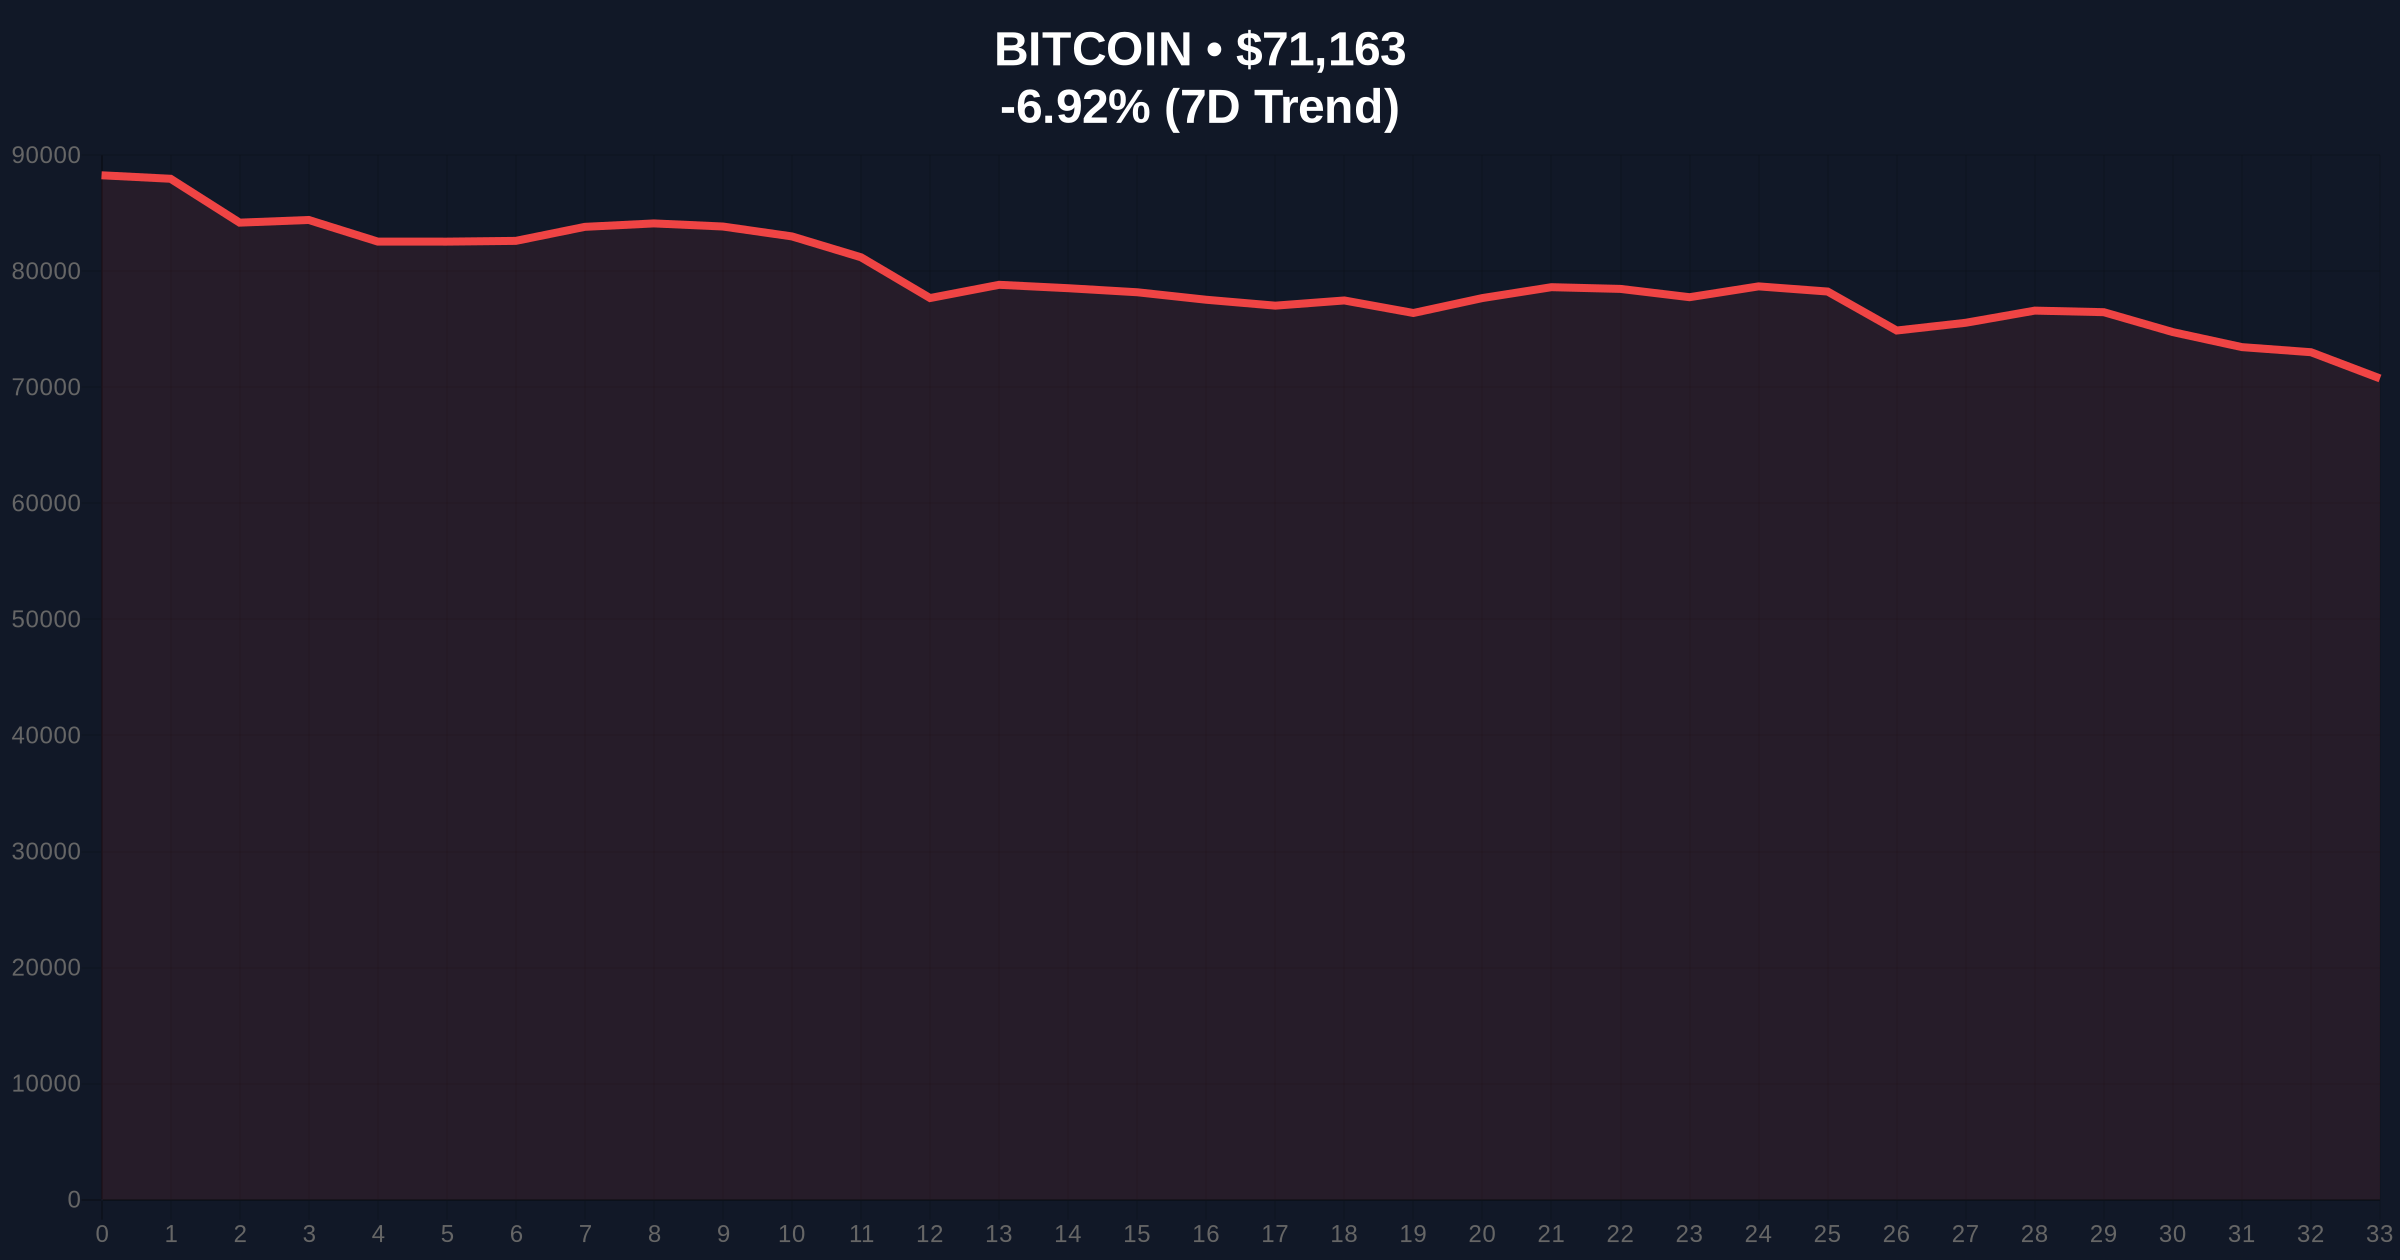
CryptoQuant's analysis, detailed in their latest market intelligence report, provides precise numerical comparisons between the current and 2022 bear markets. The firm identified November 2025 as the inflection point when Bitcoin's price decisively broke below its 365-day simple moving average (SMA). From that moment, the asset declined 23% over roughly 83 trading days. In contrast, following a similar break below the 365-day SMA in early 2022, Bitcoin only fell 6% during the subsequent 83-day period. This 283% larger decline in the current cycle forms the core of CryptoQuant's bearish thesis.
, the firm noted that Bitcoin has "lost key support" in its technical structure. Market structure suggests this refers to the breakdown below the $75,000 psychological level and the 200-day exponential moving average, which previously acted as dynamic support during the 2024-2025 bull run. Consequently, CryptoQuant's models now indicate a high probability of Bitcoin retesting the $60,000-$70,000 range, a zone that corresponds with the 0.618 Fibonacci retracement level from the 2023 low to the 2025 all-time high.
Historically, Bitcoin bear markets following all-time highs have exhibited distinct phases of capitulation. The 2017-2018 cycle saw an 84% drawdown over 364 days, while the 2021-2022 correction resulted in a 77% decline across 376 days. In contrast, the current drawdown from the 2025 high of approximately $98,000 to current levels near $71,000 represents a 27% decline. While this percentage appears smaller, the acceleration metric highlighted by CryptoQuant suggests underlying weakness.
Underlying this trend is a fundamental shift in market participation. On-chain data indicates long-term holder (LTH) supply has decreased by 3.2% over the past 90 days, according to Glassnode metrics not included in the original report. This contrasts with the 2022 cycle where LTH supply remained relatively stable during the initial decline phase. The combination of accelerated price decline and shifting holder behavior creates a more negative technical backdrop.
Related developments in this extreme fear environment include institutional adjustments like Canaccord Genuity's significant reduction of its MicroStrategy price target, reflecting broader skepticism about Bitcoin-correlated equities. Additionally, exchange dynamics show Binance maintaining dominant asset holdings despite market stress, while individual actions like Joseph Lubin's collateralized borrowing against ETH highlight defensive positioning among crypto founders.
The 365-day moving average breakdown serves as CryptoQuant's primary momentum indicator. This long-term trend line historically acts as a bull/bear demarcation zone. Bitcoin's failure to reclaim this level within 83 days contrasts sharply with the 2022 cycle, where the price oscillated around the 365-day SMA for 127 days before the final capitulation to $29,000. The current price action suggests a more decisive bearish conviction among market participants.
Volume profile analysis reveals significant trading activity between $68,000 and $72,000, creating a high-volume node that may provide temporary support. However, the relative strength index (RSI) on weekly timeframes sits at 38, indicating neither oversold nor overbought conditions but leaning bearish. The 50-week moving average at $73,500 now acts as resistance, having been breached decisively in January 2026. This creates a Fair Value Gap (FVG) between $71,000 and $73,500 that price may attempt to fill before further decline.
From a blockchain architecture perspective, Bitcoin's hash rate has remained stable near 650 EH/s despite the price decline, according to data from Blockchain.com. This suggests miner capitulation hasn't yet begun, potentially creating future selling pressure if profitability thresholds are breached. The network's difficulty adjustment mechanism, detailed in Bitcoin's original whitepaper, will play a role in maintaining security during this bear phase.
| Metric | Current Cycle (2025-2026) | 2022 Cycle |
|---|---|---|
| Decline after 365-day SMA break | 23% (83 days) | 6% (83 days) |
| Crypto Fear & Greed Index | 12/100 (Extreme Fear) | ~20/100 (Feb 2022) |
| Bitcoin Current Price | $71,194 | ~$42,000 (Feb 2022) |
| 24-Hour Price Change | -6.77% | -3.2% (Feb 2022 avg) |
| Potential Retest Range | $60,000-$70,000 | $29,000-$35,000 (2022 low) |
This accelerated decline matters because it reflects changing market microstructure. Institutional liquidity cycles typically operate on 90-120 day horizons, aligning with the 83-day measurement period. The steeper decline suggests institutional selling pressure is more concentrated than in 2022, potentially due to tighter monetary conditions as indicated by the Federal Reserve's latest policy statements. Retail market structure shows parallel stress, with exchange netflow metrics indicating sustained outflows exceeding 15,000 BTC monthly.
, the loss of key support levels creates technical damage that requires substantial time to repair. Each broken support level becomes future resistance, creating a "ceiling effect" that limits upward momentum. The $60,000-$70,000 retest zone corresponds with the 2017 cycle's inflation-adjusted all-time high of approximately $64,000, adding psychological significance to this technical level.
"CryptoQuant's data reveals a quantitative deterioration in market structure that transcends simple price comparison. The 283% larger decline over the same timeframe following the 365-day SMA break indicates weakening buyer conviction at critical technical levels. This isn't just a deeper correction—it's a faster one, suggesting different underlying dynamics than previous cycles."
Market structure suggests two primary scenarios based on current technical positioning and CryptoQuant's analysis.
The 12-month institutional outlook remains cautious but not catastrophic. Historical cycles suggest bear markets of this magnitude typically resolve within 8-14 months, placing potential bottom formation in Q3-Q4 2026. The 5-year horizon remains positive given Bitcoin's fixed supply schedule and continued adoption, but near-term price discovery will likely occur in the lower range of the current cycle.

Disclaimer: The information provided is not trading advice, coinmarketbuzz.com holds no liability for any investments made based on the information provided on this page. We strongly recommend independent research and/or consultation with a qualified professional before making any investment decisions.
coinmarketbuzz.com leverages advanced AI technology to analyze market data. All content is fact-checked and reviewed by our editorial team to ensure accuracy and neutrality.