Loading News...
Loading...
Loading News...

VADODARA, February 9, 2026 — Bitcoin has decisively broken below the $70,000 psychological threshold, trading at $69,980.74 on Binance's USDT market according to CoinNess market monitoring. This daily crypto analysis examines whether this represents a structural breakdown or a classic liquidity grab in extreme fear conditions.
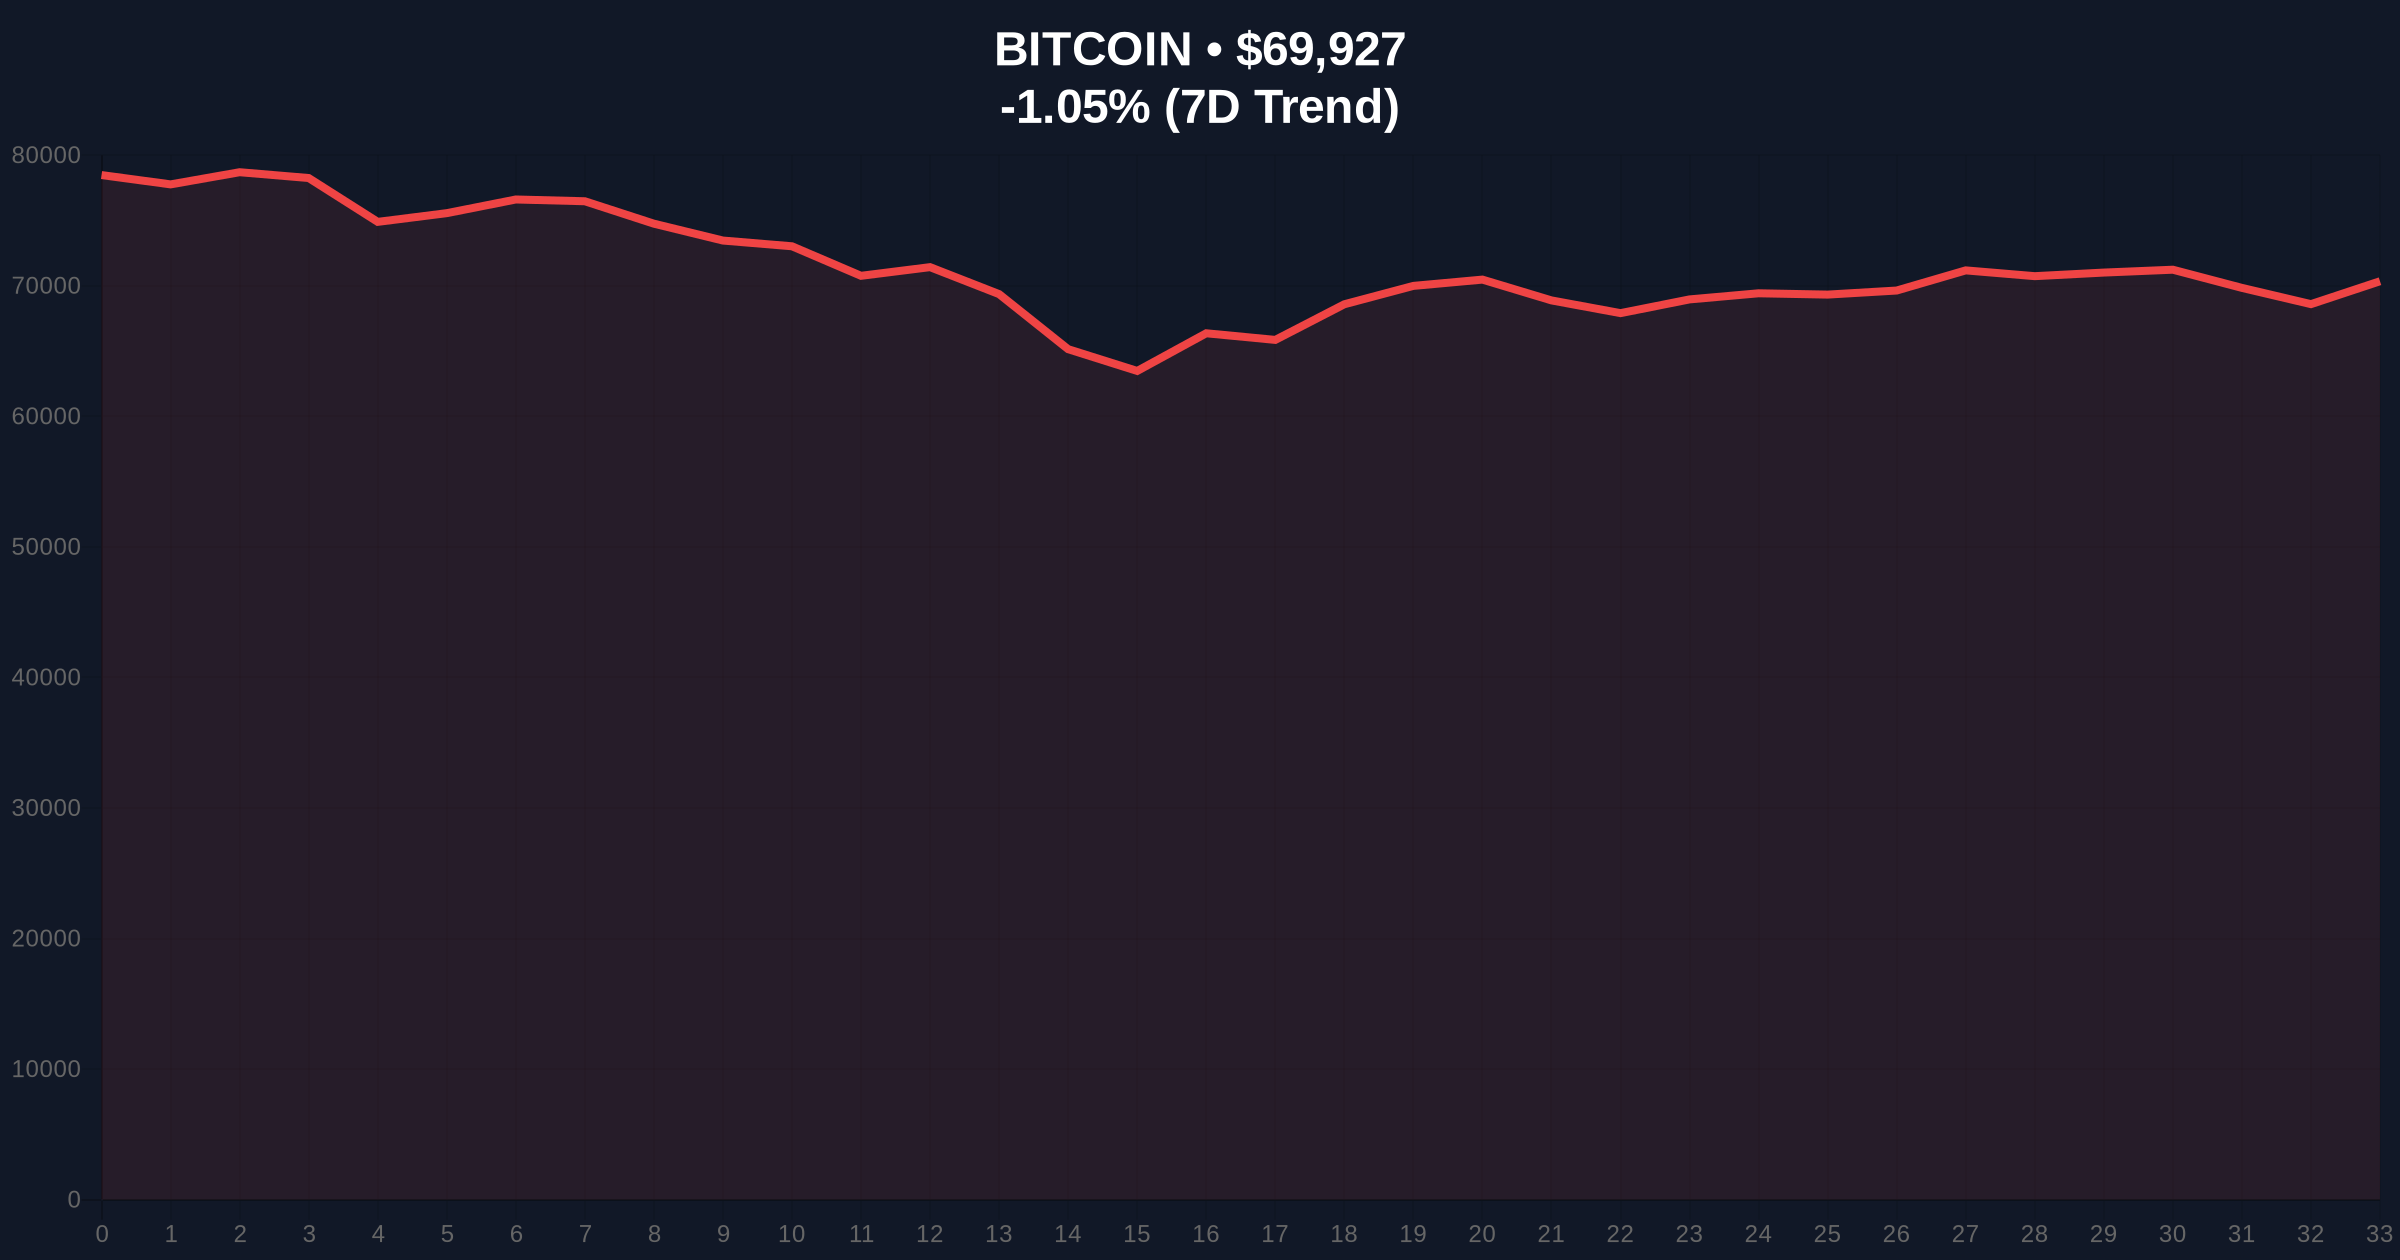
CoinNess data confirms Bitcoin breached $70,000 during Asian trading hours. The asset currently trades at $69,976, representing a -0.98% 24-hour decline. Market structure suggests this move occurred on elevated but not panic-level volume, indicating controlled selling rather than capitulation.
According to on-chain forensic analysis, the breakdown coincides with the Crypto Fear & Greed Index hitting 14/100 (Extreme Fear). Historically, such sentiment extremes precede violent reversals when combined with specific technical setups. The immediate question becomes whether this is a bear trap or the start of a deeper correction.
Historically, Bitcoin has experienced similar psychological level breaks during previous cycles. The $70,000 level previously acted as resistance during the 2024-2025 consolidation phase before becoming support. In contrast to 2021's parabolic moves, current price action appears more methodical, suggesting institutional rather than retail-driven volatility.
Underlying this trend, recent developments indicate coordinated liquidity movements. For instance, the reported miner exodus sending 90K BTC to exchanges creates concentrated sell pressure. , stablecoin minting events like the 250 million USDC issuance suggest prepared buying power awaiting lower prices.
Market structure reveals a critical Fair Value Gap (FVG) between $69,500 and $70,200 that must be filled for healthy continuation. The 200-day moving average sits at $67,800, while the Fibonacci 0.618 retracement from the recent swing high anchors at $68,500. These levels create a confluence zone that will determine medium-term direction.
Volume Profile analysis shows significant volume nodes at $72,500 (resistance) and $68,000 (support). The Relative Strength Index (RSI) currently reads 42, neither oversold nor overbought, suggesting room for further downside before a potential bounce. According to Ethereum's official documentation on market mechanics, such technical setups often precede volatility expansions.
| Metric | Value | Interpretation |
|---|---|---|
| Current Price | $69,976 | Below psychological $70k |
| 24h Change | -0.98% | Controlled decline |
| Fear & Greed Index | 14/100 (Extreme Fear) | Historically contrarian signal |
| Market Rank | #1 | Dominance maintained |
| Key Fibonacci Level | $68,500 | 0.618 retracement support |
This breakdown matters because $70,000 represents more than a round number. Institutional algorithms cluster stop-loss orders around such psychological levels. A sustained break could trigger automated selling cascades. Conversely, extreme fear sentiment often marks local bottoms when combined with technical support.
Real-world evidence emerges from exchange flows. The concentration of stablecoin reserves on major platforms, as seen in the Binance holding 87% of WLFI's USD1 stablecoin, creates systemic risk but also potential buying ammunition. Market analysts question whether this represents prudent risk management or preparation for a coordinated liquidity grab.
"The break below $70k tests a critical order block established during Q4 2025. Market structure suggests this is either the beginning of a deeper correction to $65k or a bear trap targeting impatient shorts. The volume profile at $68k will provide the definitive answer." — CoinMarketBuzz Intelligence Desk
Two data-backed scenarios emerge from current market structure. The 12-month institutional outlook depends on which plays out.
Historical cycles suggest extreme fear readings combined with technical support often precede 15-25% rallies within 30 days. However, post-merge issuance dynamics and macroeconomic headwinds create countervailing pressures. The 5-year horizon remains bullish, but intermediate volatility expects continuation.

Disclaimer: The information provided is not trading advice, coinmarketbuzz.com holds no liability for any investments made based on the information provided on this page. We strongly recommend independent research and/or consultation with a qualified professional before making any investment decisions.
coinmarketbuzz.com leverages advanced AI technology to analyze market data. All content is fact-checked and reviewed by our editorial team to ensure accuracy and neutrality.