Loading News...
Loading...
Loading News...

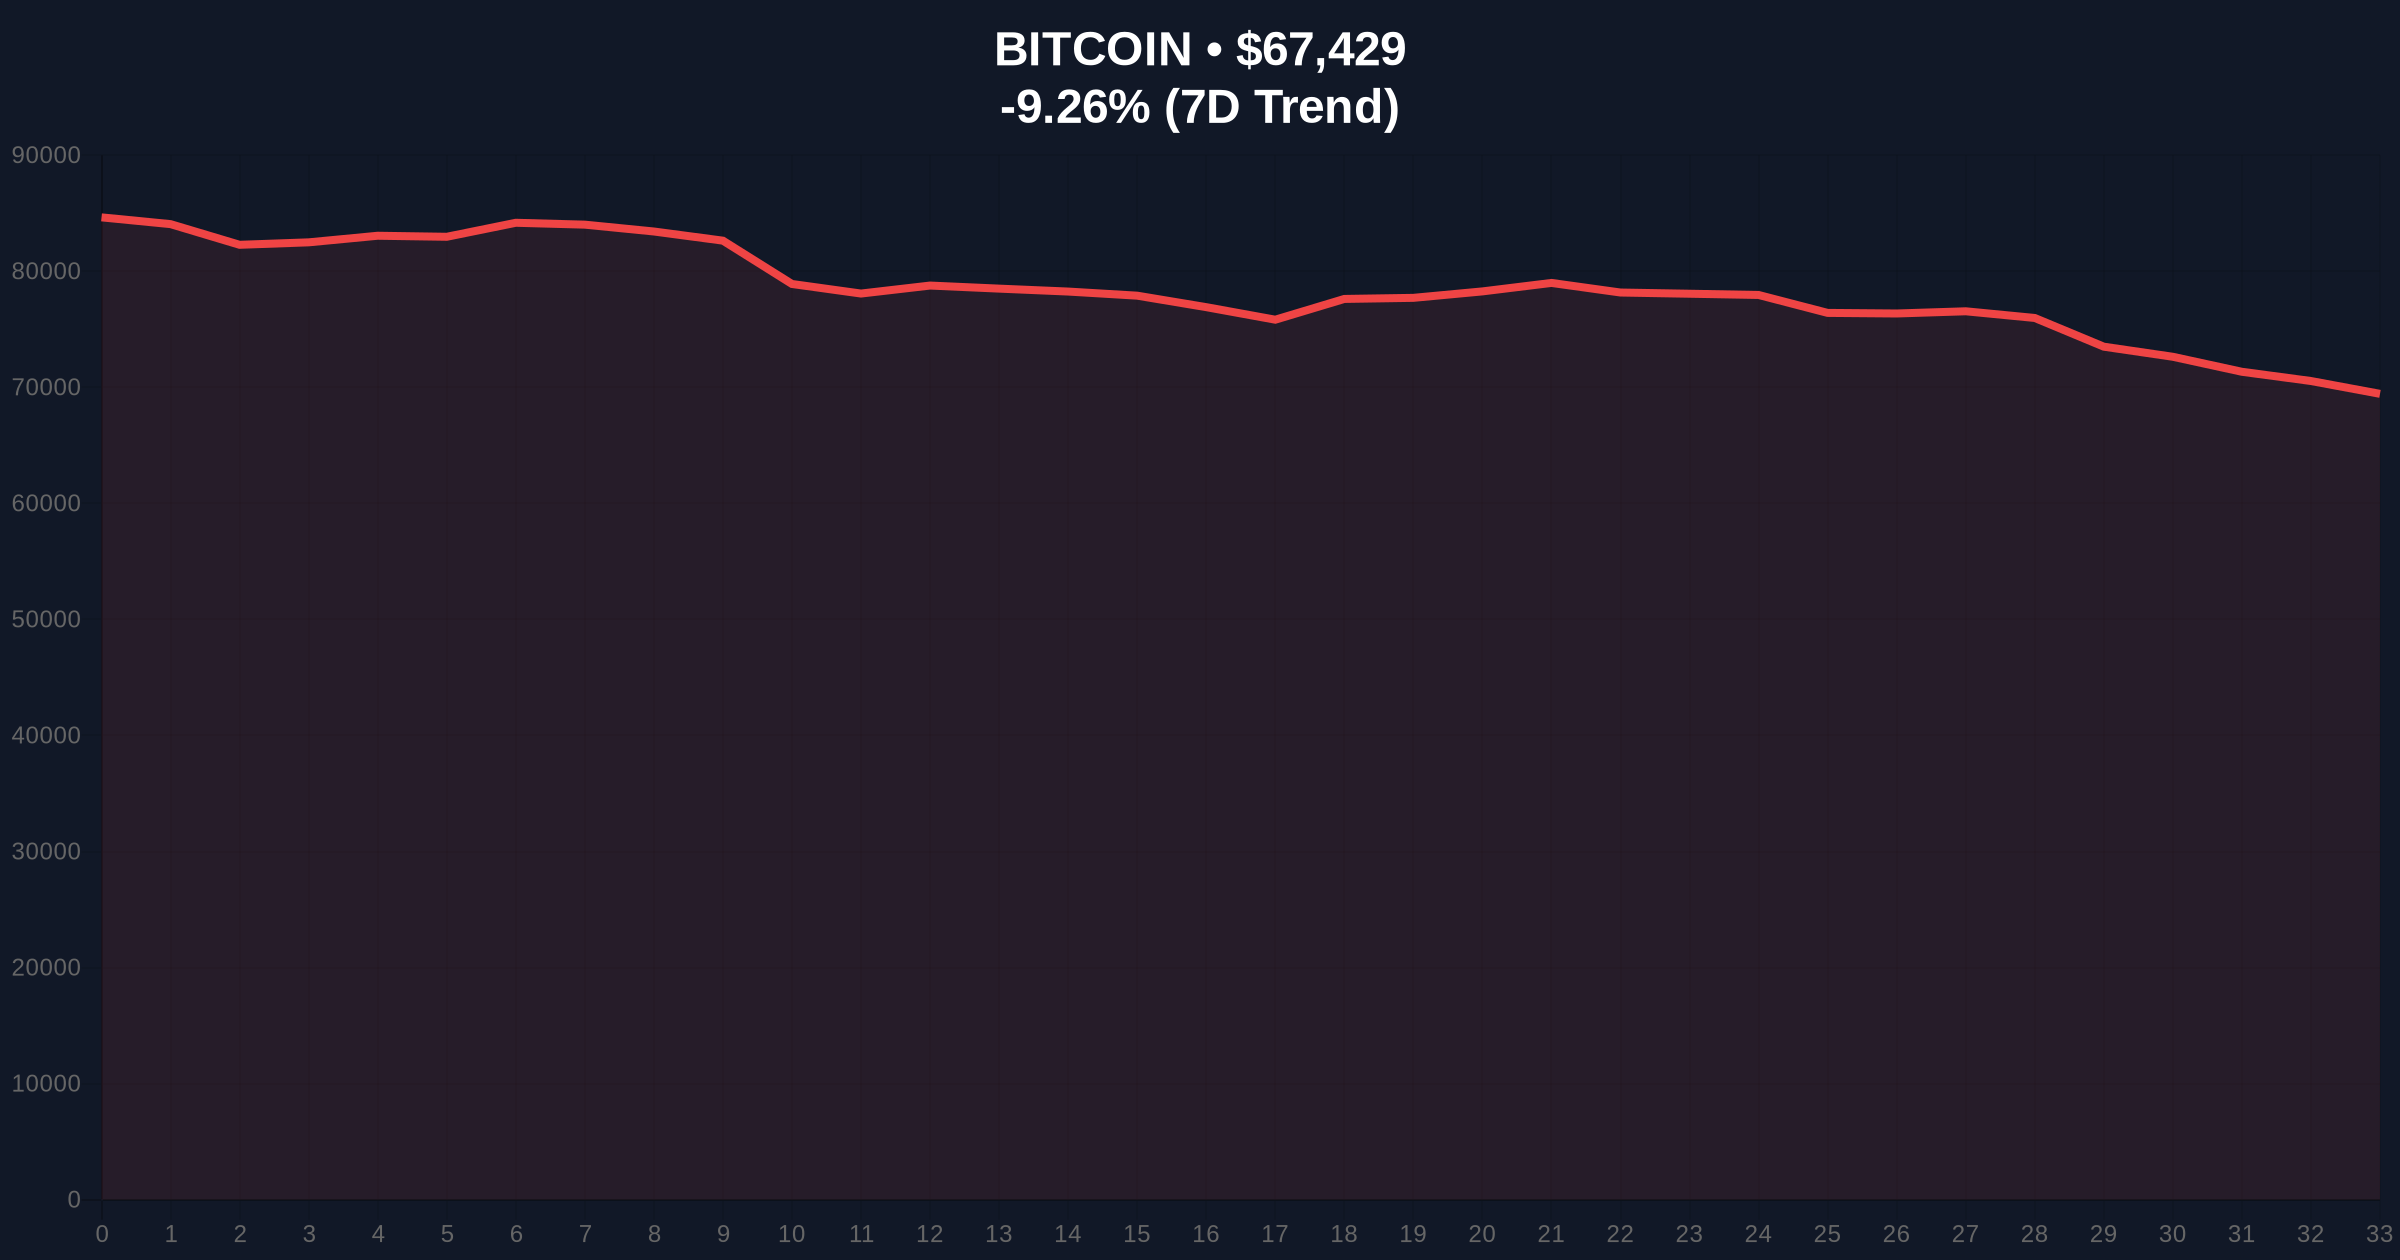
VADODARA, February 5, 2026 — Bitcoin margin long positions on Bitfinex have surged to approximately 77,100 BTC, marking their highest level since December 2023. This daily crypto analysis reveals a critical divergence as Bitcoin's price simultaneously dropped 9.17% to $67,500. According to on-chain data from Coindesk, these positions historically act as a contrarian indicator, increasing during market declines and decreasing during rallies.
Bitfinex's margin long volume now stands at a two-year peak of 77,100 BTC. This surge occurred amid Bitcoin's sharp decline from approximately $74,300 to $67,500 within 24 hours. Market structure suggests this represents a classic liquidity grab, where leveraged positions accumulate during downtrends, often preceding further volatility. The data indicates traders are aggressively betting on a rebound despite worsening price action.
Consequently, this creates a high-risk environment. Margin longs at these levels historically correlate with increased liquidation risk. The volume profile shows concentrated buying interest near current prices, forming a potential order block. If this block fails, it could trigger cascading liquidations similar to recent events documented in the $473 million futures liquidation analysis.
Historically, margin long surges during price declines have served as reliable contrarian signals. In December 2023, similar positioning preceded a 22% correction over the following month. Underlying this trend is retail trader psychology, where fear of missing out on perceived bottoms drives leveraged entries. This pattern mirrors the 2021 cycle, where excessive margin longs at $58,000 preceded a 35% drawdown.
In contrast, institutional positioning shows divergence. While retail leverage spikes, institutional flows through products like Bitwise Custom Yield strategies remain measured. This disconnect highlights the growing retail-institutional gap in risk assessment. , global liquidity conditions, as seen in Upbit's liquidity crunch, exacerbate margin pressure.
Bitcoin currently tests critical Fibonacci support at the 0.618 retracement level of $65,200, derived from the November 2025 to January 2026 rally. The Relative Strength Index (RSI) sits at 28, indicating oversold conditions but not yet extreme capitulation. The 50-day moving average at $71,400 now acts as resistance, creating a $4,000 fair value gap (FVG) between current price and mean reversion targets.
Market structure suggests the surge in margin longs creates a gamma squeeze scenario. As prices approach liquidation clusters near $64,800, forced selling could accelerate. The UTXO age distribution shows increased movement from 3-6 month holders, indicating distribution rather than accumulation. This technical setup requires monitoring the $65,200 level for structural integrity.
| Metric | Value | Significance |
|---|---|---|
| Bitfinex BTC Margin Longs | 77,100 BTC | 2-year high (since Dec 2023) |
| Bitcoin Current Price | $67,500 | -9.17% 24h change |
| Crypto Fear & Greed Index | 12/100 (Extreme Fear) | Lowest since October 2025 |
| RSI (Daily) | 28 | Oversold territory |
| Fibonacci 0.618 Support | $65,200 | Critical technical level |
This divergence matters because margin positioning often leads price action by 7-14 days. According to historical data from Glassnode, similar surges preceded corrections averaging 18% over two weeks. The current 77,100 BTC in margin longs represents approximately $5.2 billion in leveraged exposure, creating systemic risk if prices decline further.
Real-world evidence appears in exchange behavior. Platforms like Gemini are retreating from key markets, reducing liquidity during precisely these high-leverage periods. This institutional pullback contrasts sharply with retail margin enthusiasm, creating a dangerous asymmetry. The market structure now resembles Q2 2022, where margin long peaks preceded the Luna/Terra collapse.
"Margin data from Bitfinex shows classic capitulation behavior. Traders are doubling down on longs as prices fall, creating what we call a 'negative gamma trap.' When leverage concentrates at specific levels, any break below $65,000 could trigger automated liquidations exceeding $1.5 billion based on current order book depth." — CoinMarketBuzz Intelligence Desk
Market structure suggests two primary scenarios based on the margin long data and technical levels.
The 12-month institutional outlook remains cautious. While EIP-4844 implementation on Ethereum could provide cross-chain momentum, Bitcoin's current leverage overhang requires resolution. Historical cycles suggest deleveraging events typically last 4-6 weeks, potentially pushing Bitcoin toward the $58,000-$62,000 range before establishing a durable bottom. The 5-year horizon remains intact, but short-term risk management is paramount.

Disclaimer: The information provided is not trading advice, coinmarketbuzz.com holds no liability for any investments made based on the information provided on this page. We strongly recommend independent research and/or consultation with a qualified professional before making any investment decisions.
coinmarketbuzz.com leverages advanced AI technology to analyze market data. All content is fact-checked and reviewed by our editorial team to ensure accuracy and neutrality.