Loading News...
Loading...
Loading News...

VADODARA, February 9, 2026 — Bitcoin's price collapsed from $77,000 to $60,000 in a sharp, liquidity-driven move primarily fueled by the hedging mechanics of options market makers. According to an analysis by 10x Research, approximately $1.5 billion in short gamma positions accumulated during the decline, creating a self-reinforcing feedback loop of selling pressure. This daily crypto analysis examines the structural cause behind the plunge, connecting derivatives market activity to spot price volatility.
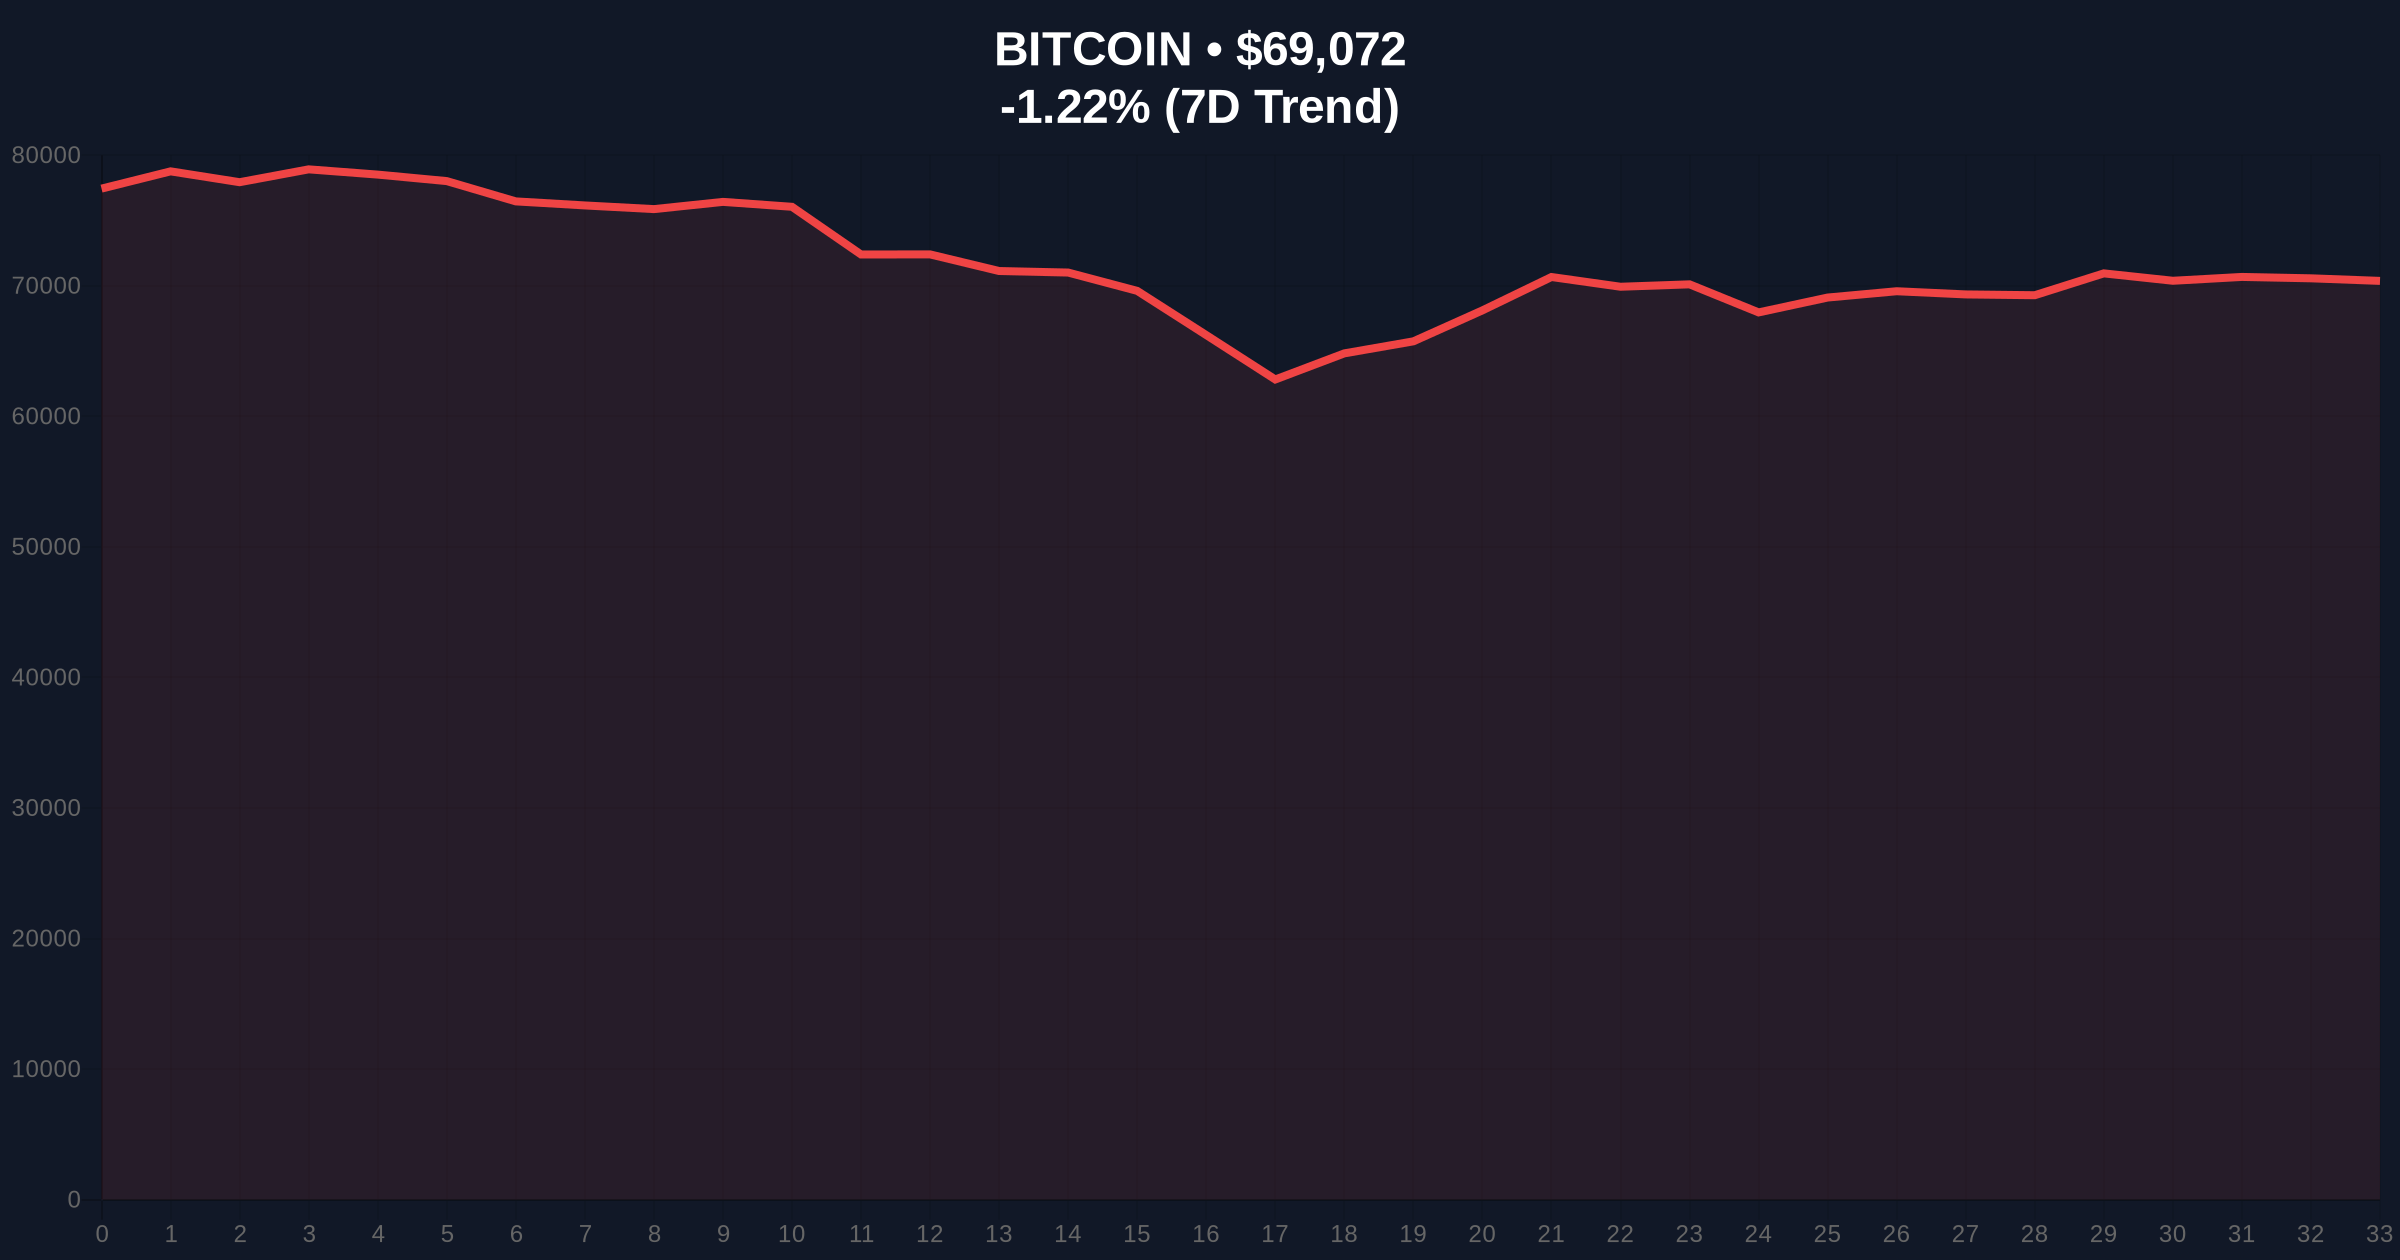
Markus Thielen, CEO of 10x Research, provided a forensic breakdown to CoinDesk. Market makers (MMs) in the Bitcoin options market held a large short gamma position as prices began falling. In a short gamma scenario, MMs must dynamically hedge their risk by selling the underlying asset—Bitcoin—as its price declines. This activity directly injects additional sell-side liquidity into the spot market. Thielen explained that this hedging created amplified downward pressure, turning a correction into a cascade. The price only found a floor at $60,000 after this forced selling was fully absorbed by the market. The analysis, detailed in the original 10x Research report, highlights a critical link between derivatives growth and spot instability.
Historically, similar gamma squeezes have precipitated sharp corrections in traditional finance, notably during the 2018 Volmageddon event in U.S. equity markets. In contrast, Bitcoin's 2021 cycle saw volatility driven more by retail leverage and exchange liquidations. Underlying this trend is the exponential growth of the BTC options market, which now exerts a gravitational pull on spot price discovery. The current environment mirrors aspects of March 2020, where derivative hedging exacerbated the initial COVID-19 crash. Consequently, the market structure has evolved from being retail-dominated to one where institutional options flows dictate short-term price action.
Related developments in the crypto ecosystem include the overheating of Ethereum funding rates, indicating parallel derivative risks, and regulatory scrutiny on exchanges like Bithumb in South Korea, which can affect market liquidity.
Market structure suggests the plunge invalidated a key order block between $70,000 and $72,000, creating a significant Fair Value Gap (FVG). The rebound from $60,000 is currently testing the 0.5 Fibonacci retracement level at $68,500. On-chain data from Glassnode indicates a surge in UTXO (Unspent Transaction Output) movements aged 3-6 months, signaling long-term holder distribution during the decline. The Relative Strength Index (RSI) on the daily chart plunged to 22, entering oversold territory, but has since recovered to 45. The 200-day moving average at $58,000 now acts as a critical macro support. This technical setup is reminiscent of the Q4 2022 bear market bottom, where derivative-induced selling climaxed before a sustained reversal.
| Metric | Value | Context |
|---|---|---|
| Crypto Fear & Greed Index | 14/100 (Extreme Fear) | Indicates peak capitulation sentiment |
| Bitcoin Current Price | $69,112 | Rebound from $60,000 low |
| 24-Hour Price Trend | -1.17% | Consolidation after sharp decline |
| Short Gamma Position (Peak) | $1.5 Billion | Amplified selling pressure (10x Research) |
| Price Range (Event) | $77,000 to $60,000 | -22% decline driven by hedging |
This event matters because it exposes a fundamental vulnerability in Bitcoin's market microstructure. The growth of the options market, while providing liquidity and hedging tools, now directly dictates spot volatility through gamma exposure. Institutional liquidity cycles are increasingly synchronized with derivatives expiry windows and dealer hedging flows. Retail market structure is often caught in these liquidity grabs, as seen in the rapid liquidation of leveraged long positions. Evidence from the U.S. Securities and Exchange Commission filings shows growing institutional participation in crypto derivatives, which may increase systemic linkages. Consequently, price discovery is no longer a pure function of supply and demand but a complex interplay of derivative Greeks.
The $1.5 billion short gamma position acted as an accelerant to the sell-off. Market makers were forced to sell Bitcoin into a declining market to hedge their options book, creating a negative feedback loop. This is a classic symptom of a market where derivatives growth outpaces spot liquidity. The rebound indicates the hedging pressure has been exhausted, for now.
— CoinMarketBuzz Intelligence Desk
Two data-backed technical scenarios emerge from the current market structure. The bullish scenario requires a sustained break above the Fibonacci 0.618 retracement level at $72,500, which would fill the FVG and signal a resumption of the prior uptrend. The bearish scenario involves a rejection at this level and a retest of the $60,000 support, potentially leading to a breakdown toward the 200-day MA at $58,000.
The 12-month institutional outlook remains cautiously optimistic, as derivative-induced volatility often creates long-term buying opportunities. However, the 5-year horizon depends on whether the market develops more robust liquidity buffers to absorb gamma shocks, possibly through improved market-making protocols or regulatory frameworks for derivatives reporting.

Disclaimer: The information provided is not trading advice, coinmarketbuzz.com holds no liability for any investments made based on the information provided on this page. We strongly recommend independent research and/or consultation with a qualified professional before making any investment decisions.
coinmarketbuzz.com leverages advanced AI technology to analyze market data. All content is fact-checked and reviewed by our editorial team to ensure accuracy and neutrality.