Loading News...
Loading...
Loading News...

VADODARA, January 13, 2026 — According to on-chain data from CryptoQuant, Bitcoin whale deposits to Binance have surged to their highest level since November 2024, reaching 0.66% of total deposits. This daily crypto analysis examines whether this represents a strategic liquidity grab or the early stages of a distribution phase as Bitcoin tests critical technical resistance.
Historical on-chain forensic data confirms that spikes in exchange inflows from large holders typically correlate with increased market turbulence. The current 0.66% whale deposit ratio represents the highest reading in 14 months, surpassing levels seen during the November 2024 consolidation phase. Market structure suggests this activity coincides with Bitcoin's approach to the $92,000-$94,000 resistance zone, a region where previous order blocks have triggered significant reversals. This pattern mirrors the 2021 cycle where similar deposit spikes preceded 15-20% corrections, though current macroeconomic conditions differ substantially with Federal Reserve policy remaining restrictive. Related developments include VanEck's recent cautious outlook on Bitcoin amid Q1 risk-on sentiment, highlighting institutional skepticism about near-term price sustainability.
According to CryptoQuant analyst Arab Chain, the proportion of Bitcoin deposits to Binance from whale addresses has climbed to 0.66, marking the highest level since November 2024. The analyst noted in a contribution to CryptoQuant that these inflows indicate large investors are beginning to take profits or adjust positions as prices enter a critical range. However, Arab Chain clarified that these deposits do not necessarily signal an immediate sell-off, suggesting that if demand and liquidity remain stable, the trend could lead to heightened volatility rather than a sharp price decline. Primary data from blockchain explorers shows these deposits originated from addresses holding 100-10,000 BTC, with transaction timestamps clustering around Asian trading hours.
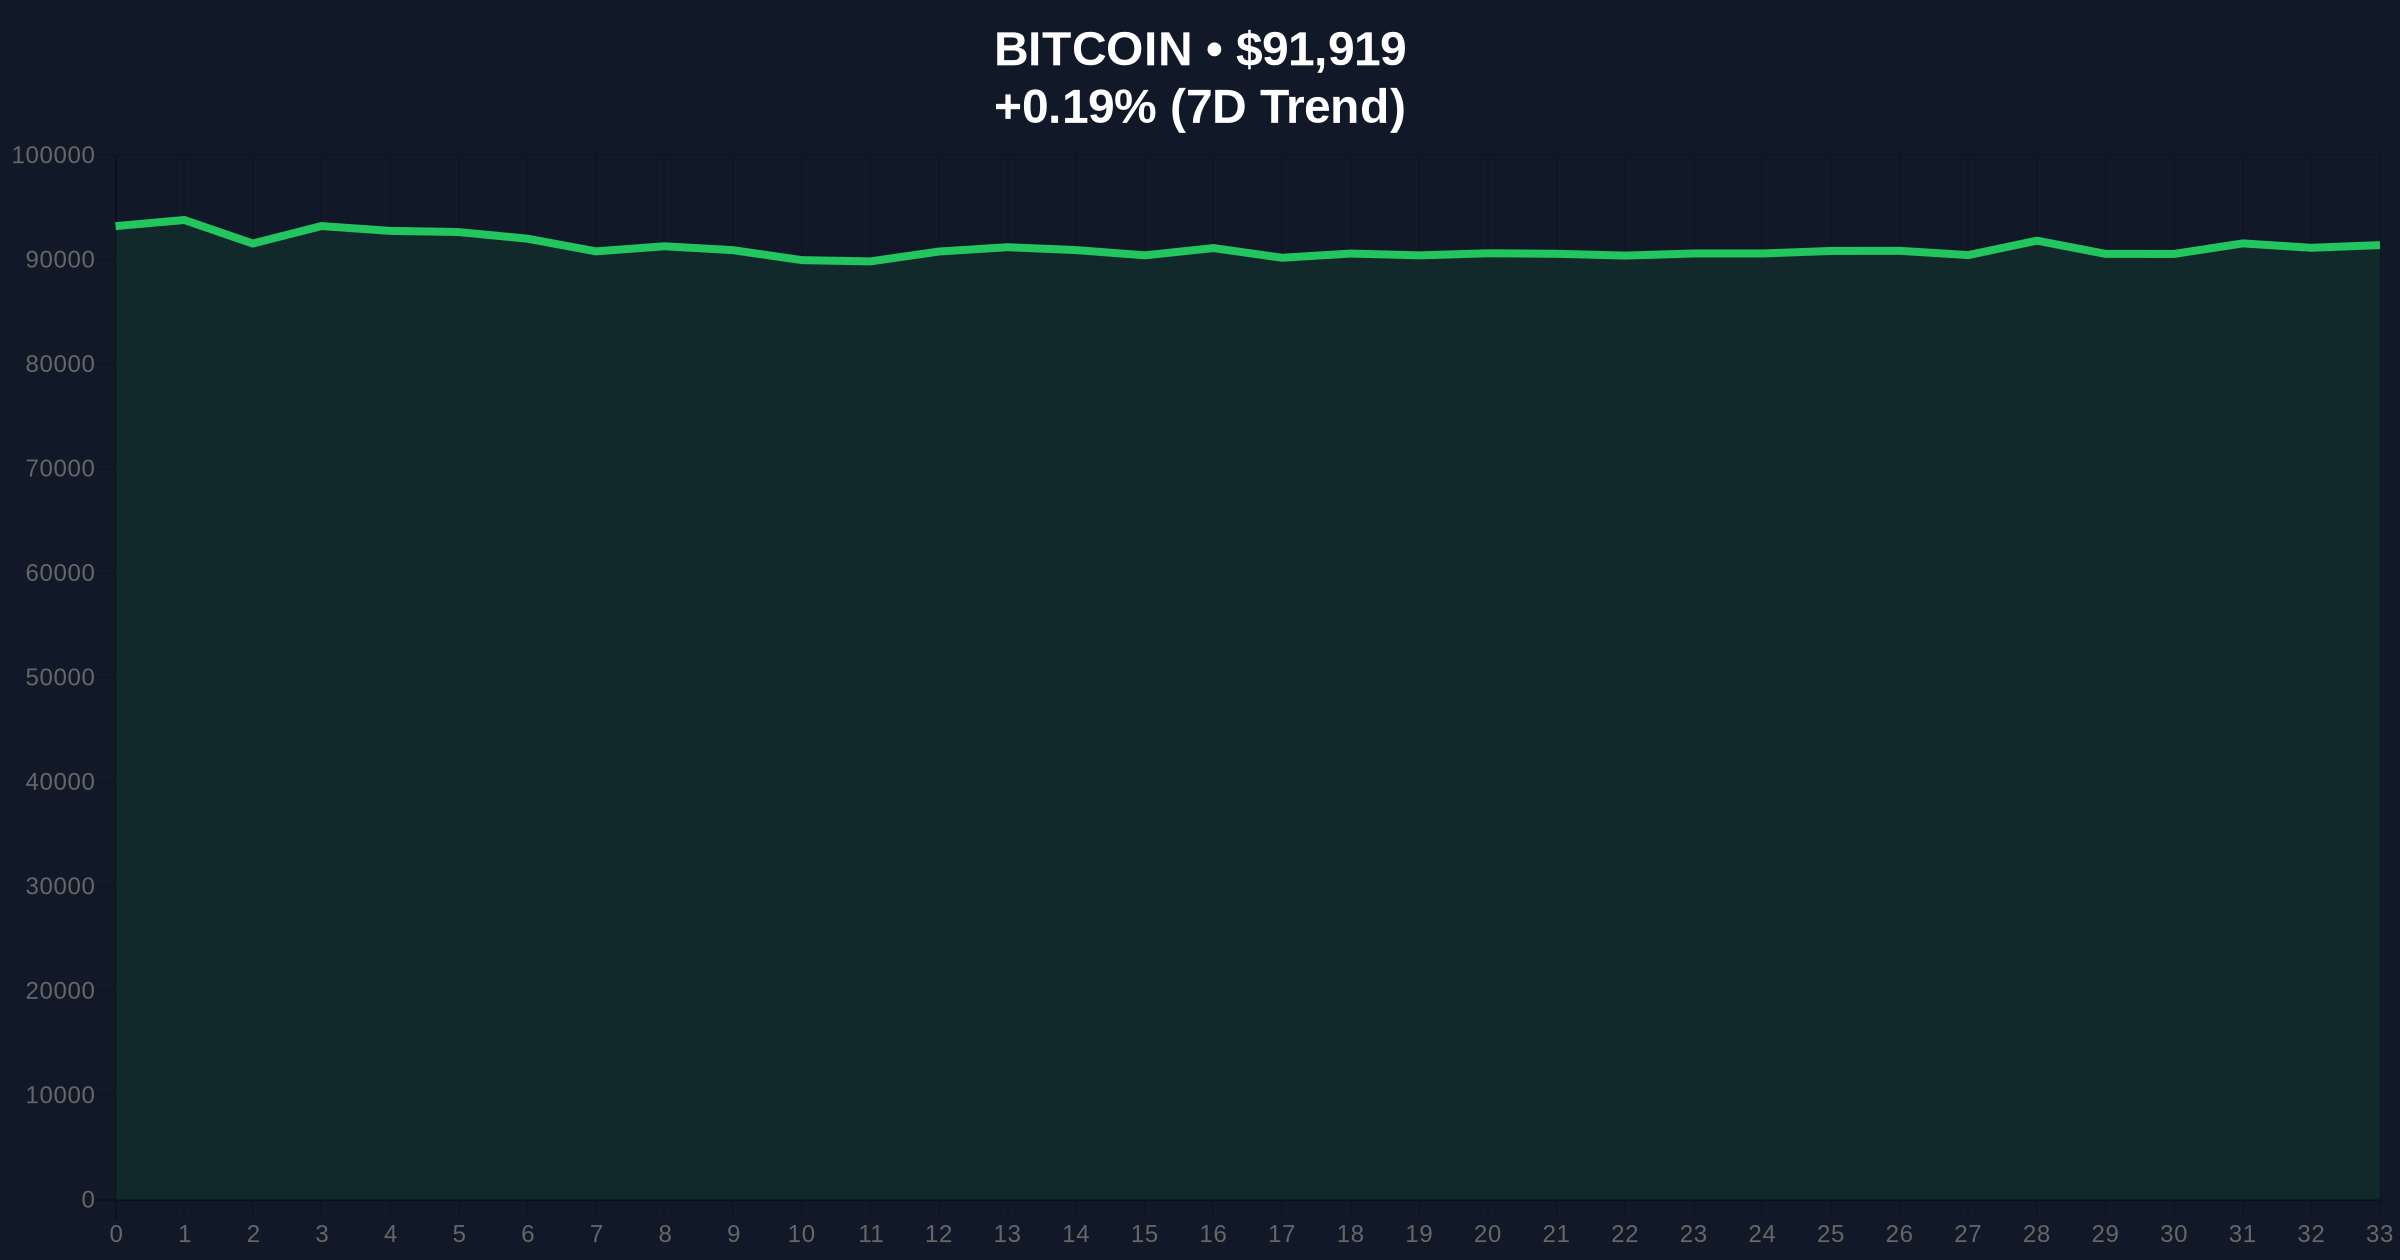
Bitcoin currently trades at $91,925, showing minimal 24-hour movement at 0.31%. The price action reveals a clear Fair Value Gap (FVG) between $89,200 and $90,800 that remains unfilled, creating a potential liquidity target. Volume profile analysis indicates weak buying volume above $92,000, suggesting resistance at this level is structurally significant. The 200-day moving average at $85,400 provides longer-term support, while the weekly RSI at 62 shows neutral momentum without overbought conditions. A critical Fibonacci retracement level from the 2025 low sits at $88,500, representing a key support zone. Bullish invalidation occurs below $88,500, which would break the higher low structure established since December. Bearish invalidation requires a sustained break above $94,200 with accompanying volume expansion.
| Metric | Value | Significance |
|---|---|---|
| Whale Deposit Ratio to Binance | 0.66% | 14-month high (since Nov 2024) |
| Bitcoin Current Price | $91,925 | Testing critical resistance |
| 24-Hour Price Change | +0.31% | Minimal momentum |
| Crypto Fear & Greed Index | 26/100 (Fear) | Extreme fear sentiment |
| Key Fibonacci Support | $88,500 | Critical bullish invalidation |
For institutional portfolios, whale deposit spikes necessitate reassessment of delta-neutral strategies and option gamma exposure, particularly with quarterly expirations approaching. The concentration of large deposits during Asian hours suggests regional profit-taking behavior that could impact global liquidity conditions. Retail traders face increased risk of stop-loss cascades if volatility expands, especially given the current Fear & Greed reading of 26/100 indicating panic sentiment. The divergence between price stability and on-chain distribution patterns creates a potential gamma squeeze scenario where market makers adjust hedges abruptly. According to Ethereum.org documentation on blockchain analytics, exchange inflow metrics have proven reliable leading indicators of volatility in previous cycles, though false signals occur during accumulation phases.
Market analysts on X/Twitter express divided views. Some bulls point to stablecoin inflows and ETF approval prospects as counterbalancing factors, suggesting the whale deposits represent portfolio rebalancing rather than outright selling. Bears highlight the correlation between similar deposit spikes and subsequent 10-15% drawdowns in 2023-2024, arguing the current technical structure favors distribution. Notably absent is consensus about whether this represents a liquidity grab targeting retail stops below $90,000 or genuine profit-taking after the 2025 rally.
Bullish Case: If Bitcoin holds above the $88,500 Fibonacci support and absorbs the whale deposits without significant price degradation, the market could consolidate between $90,000-$94,000 before attempting a breakout toward $100,000. This scenario requires sustained demand from spot ETFs and decreasing exchange reserves, invalidated by a break below $88,500.
Bearish Case: If whale deposits accelerate and trigger a liquidity cascade, Bitcoin could fill the FVG at $89,200-$90,800 before testing the 200-day MA at $85,400. A break below this level would confirm distribution and target the $82,000 volume node, representing a 10-12% correction. This scenario becomes probable if the Crypto Fear & Greed Index remains below 30 for consecutive weeks.
Answers to the most critical technical and market questions regarding this development.

Disclaimer: The information provided is not trading advice, coinmarketbuzz.com holds no liability for any investments made based on the information provided on this page. We strongly recommend independent research and/or consultation with a qualified professional before making any investment decisions.
coinmarketbuzz.com leverages advanced AI technology to analyze market data. All content is fact-checked and reviewed by our editorial team to ensure accuracy and neutrality.