Loading News...
Loading...
Loading News...

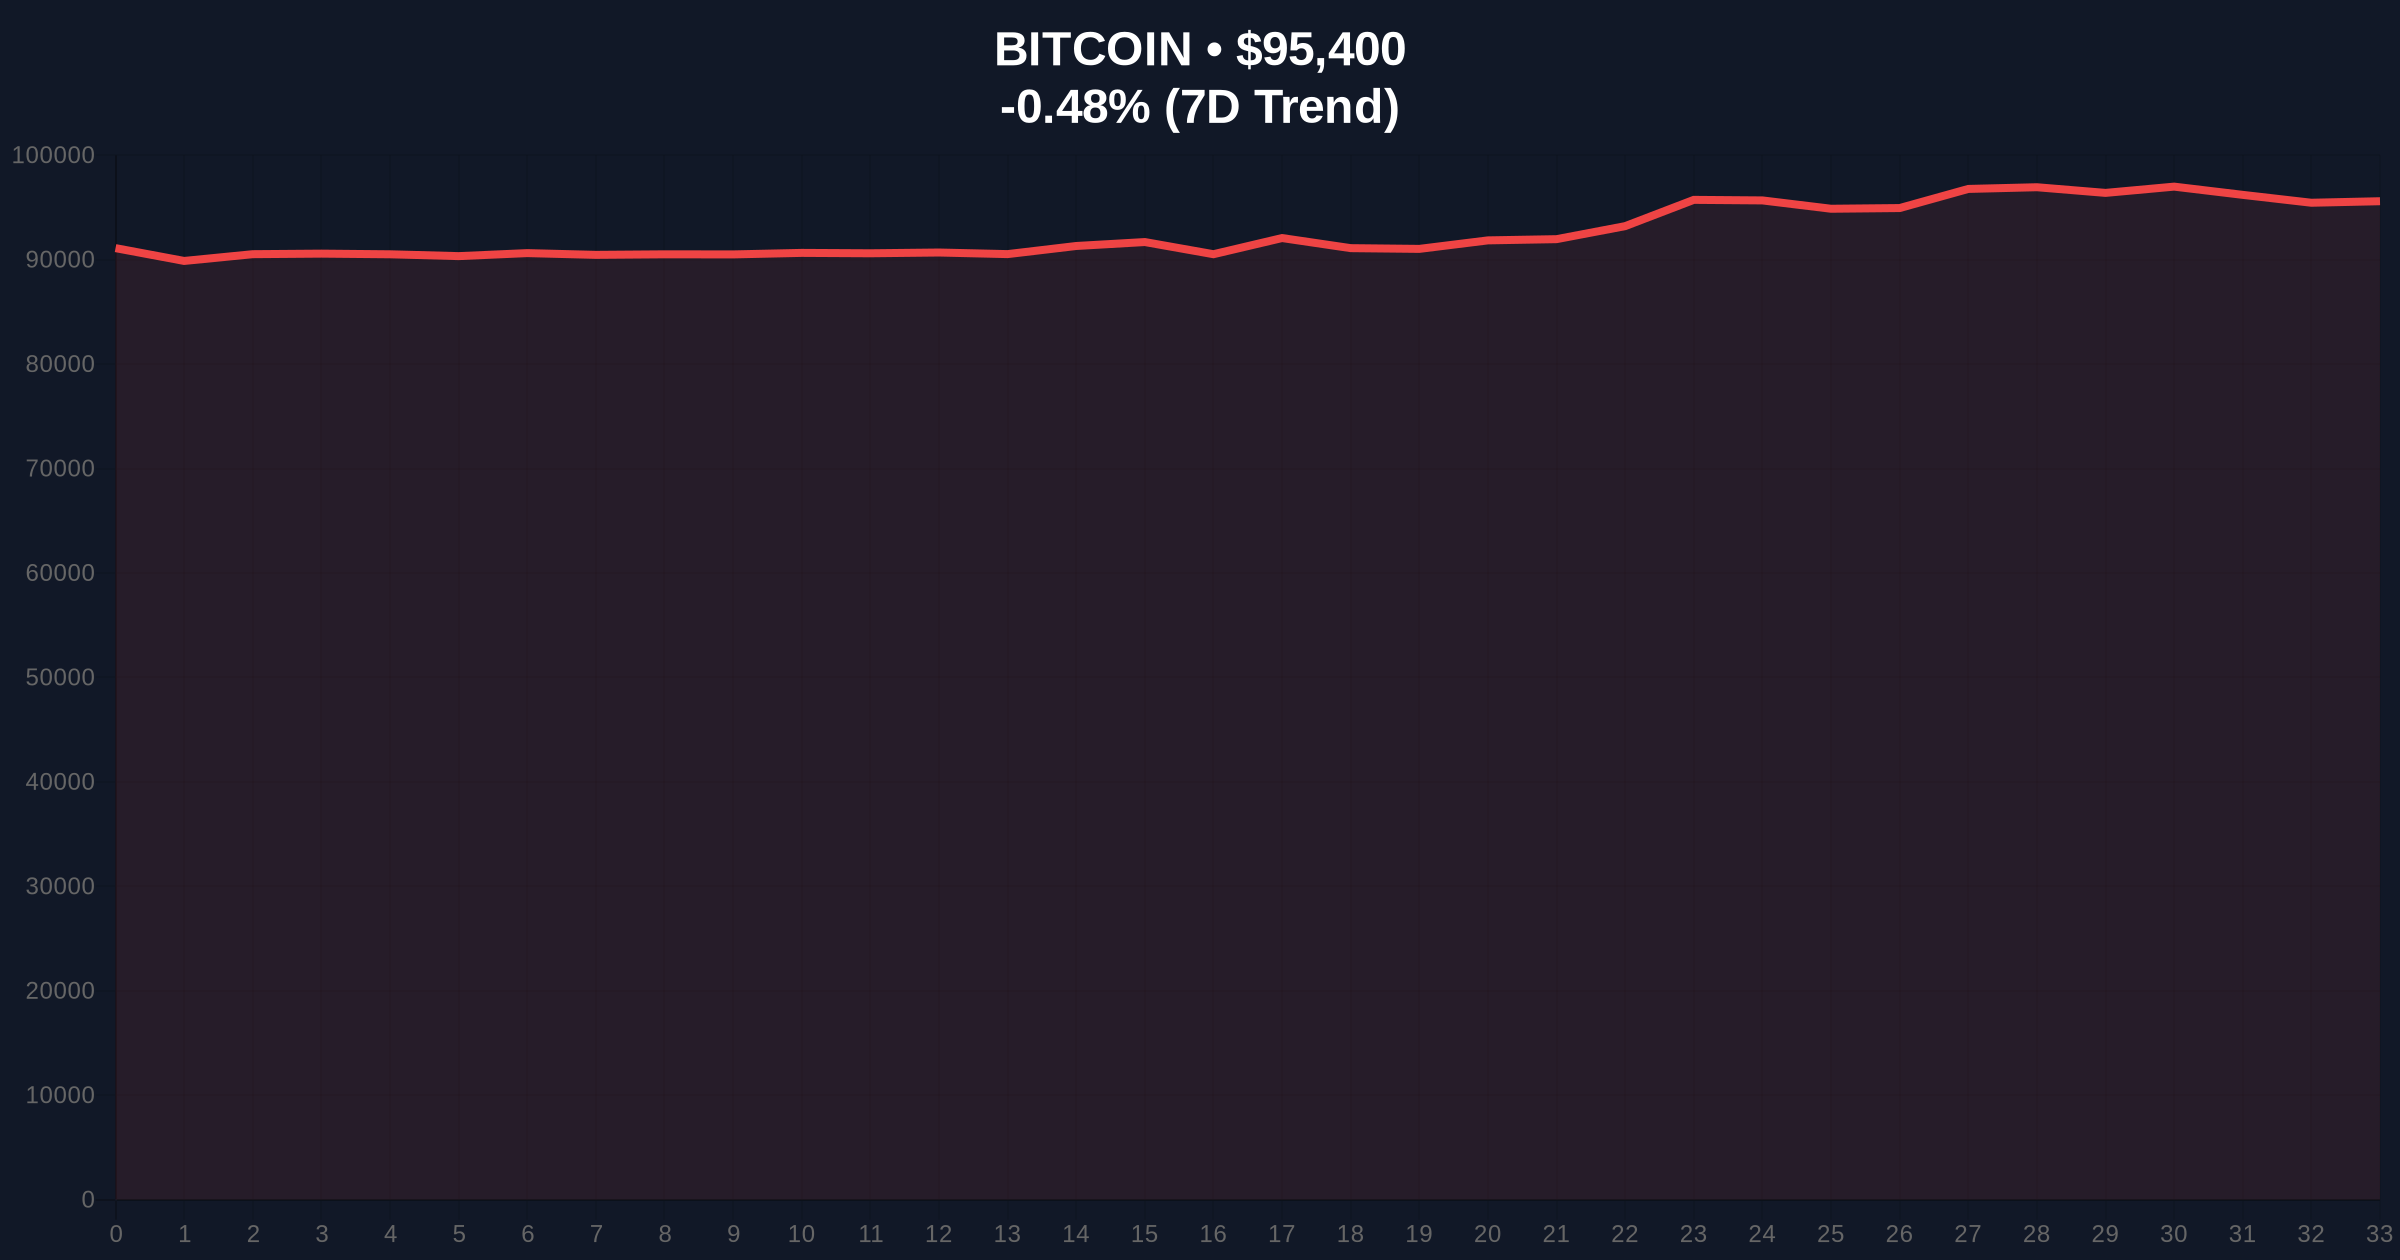
VADODARA, January 16, 2026 — U.S. spot Bitcoin exchange-traded funds recorded $104.08 million in net inflows on January 15, marking the fourth consecutive day of positive flows according to data compiled by TraderT. This daily crypto analysis examines the underlying market structure as Bitcoin consolidates near $95,407 with a 24-hour decline of -0.49%. Market structure suggests institutional accumulation is creating a volume profile imbalance that could resolve with either a liquidity grab above $100,000 or a retest of lower support clusters.
The current inflow pattern mirrors the post-ETF approval accumulation phase of early 2024, but with significantly higher baseline capital deployment. According to on-chain data from Glassnode, the realized price for long-term holders has steadily climbed to $78,000, indicating strong conviction among institutional entities. This trend coincides with broader macroeconomic conditions where traditional safe-haven assets face pressure from persistent inflation concerns, detailed in recent Federal Reserve communications. Consequently, Bitcoin's correlation with traditional risk assets has decoupled slightly, positioning it as a distinct macro hedge. Related developments in the regulatory include Russia's new crypto transaction reporting mandate, which analysts view as a potential liquidity grab affecting global capital flows.
On January 15, 2026, TraderT data confirmed net positive flows of $104.08 million across all U.S. spot Bitcoin ETFs. BlackRock's IBIT dominated with an inflow of $319.7 million, while Grayscale's Mini BTC and Valkyrie's BRRR recorded smaller inflows of $6.74 million and $2.96 million, respectively. These inflows were partially offset by significant outflows from Fidelity's FBTC, which lost $188.89 million, and continued outflows from Grayscale's GBTC, which saw $36.43 million exit. This fund rotation indicates a shift in institutional preference toward lower-fee products, creating internal capital reallocation within the ETF ecosystem rather than pure net new investment.
Bitcoin's price action at $95,407 shows consolidation within a tightening range between $92,500 and $97,200. The 50-day exponential moving average (EMA) at $93,800 provides immediate dynamic support, while the weekly Relative Strength Index (RSI) reads 62, indicating neutral-to-bullish momentum without overextension. A clear Fair Value Gap (FVG) exists between $94,000 and $95,500 from last week's price rejection, which market structure suggests will be filled before any sustained move higher. The critical Fibonacci retracement level from the recent swing high sits at $92,500 (61.8% retracement), serving as a major order block for institutional buyers. Bullish invalidation occurs below $90,000, where the 200-day EMA and psychological support converge. Bearish invalidation triggers above $100,000, invalidating the current consolidation structure and potentially triggering a gamma squeeze in options markets.
| Metric | Value | Source |
|---|---|---|
| Daily Net ETF Inflow (Jan 15) | $104.08M | TraderT |
| Bitcoin Current Price | $95,407 | Live Market Data |
| 24-Hour Price Change | -0.49% | Live Market Data |
| Crypto Fear & Greed Index | 49/100 (Neutral) | Live Market Data |
| BlackRock IBIT Daily Inflow | $319.7M | TraderT |
For institutional portfolios, sustained ETF inflows provide a structural bid for Bitcoin, reducing volatility during accumulation phases. The rotation from higher-fee products like GBTC to lower-fee alternatives such as IBIT indicates mature capital allocation strategies focused on long-term cost efficiency. For retail traders, this creates a divergence between spot-driven institutional accumulation and futures market sentiment, where recent futures liquidations have exceeded $145 million in long position squeezes. Underlying this trend is the fundamental shift in Bitcoin's supply dynamics, with over 70% of the circulating supply now held in illiquid wallets according to Glassnode liquidity maps.
Market analysts on X/Twitter highlight the divergence between ETF inflows and price action. One quantitative researcher noted, "The four-day inflow streak suggests accumulation, but the internal rotation from FBTC to IBIT shows institutions are optimizing fee structures, not just blindly buying." Another analyst pointed to the potential for a "liquidity grab" above $100,000 if the current consolidation resolves bullishly. Bears counter that the recent rally toward $100k was driven primarily by short covering rather than organic demand, questioning the sustainability of current levels.
Bullish Case: If ETF inflows continue at or above the current pace, Bitcoin could fill the FVG and test the $100,000 psychological resistance. A weekly close above this level would invalidate the bearish structure and potentially trigger a gamma squeeze as options dealers hedge their exposure. The primary target becomes the $110,000 region, where significant volume profile resistance exists.Bearish Case: If outflows from FBTC and GBTC accelerate, net inflows could turn negative, removing the institutional bid support. A breakdown below the $92,500 Fibonacci support would target the next major order block at $88,000, aligning with the 200-day EMA. This scenario would likely coincide with broader risk-off sentiment in traditional markets.
Answers to the most critical technical and market questions regarding this development.

Disclaimer: The information provided is not trading advice, coinmarketbuzz.com holds no liability for any investments made based on the information provided on this page. We strongly recommend independent research and/or consultation with a qualified professional before making any investment decisions.
coinmarketbuzz.com leverages advanced AI technology to analyze market data. All content is fact-checked and reviewed by our editorial team to ensure accuracy and neutrality.