Loading News...
Loading...
Loading News...

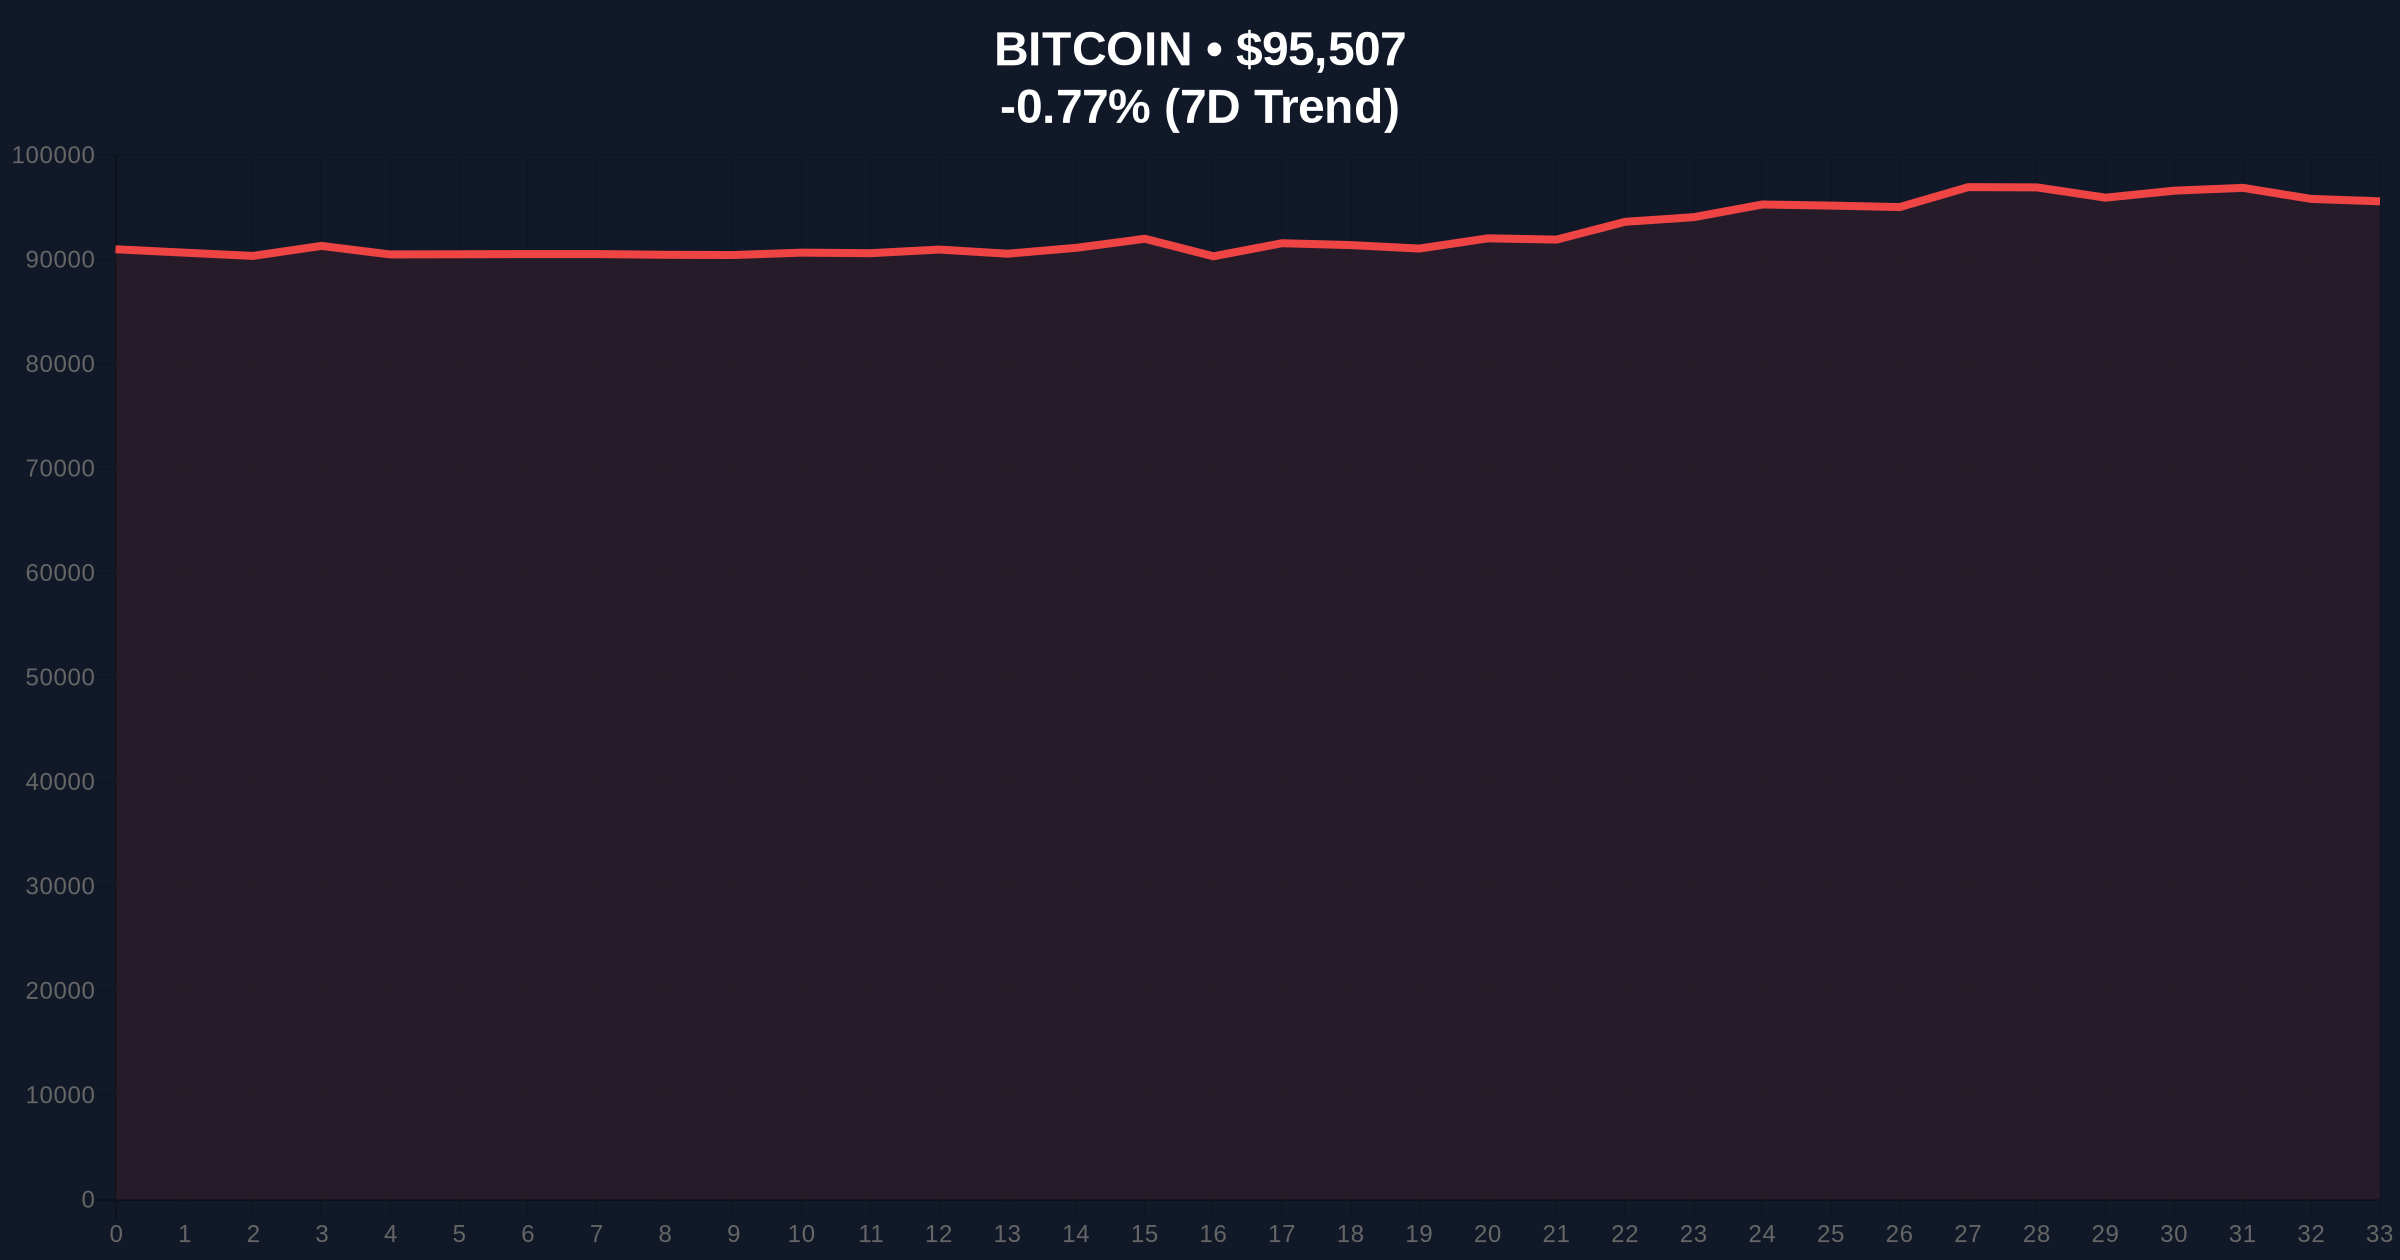
VADODARA, January 16, 2026 — Bitcoin's recent surge toward the $100,000 psychological level is a technical rebound fueled by short covering and ETF inflows, not a structural trend reversal, according to primary data from market makers. This daily crypto analysis dissects the liquidity dynamics behind the move, with market structure suggesting a cautious outlook for sustained upward momentum.
Bitcoin's price action has historically been punctuated by liquidity-driven rallies that precede consolidation phases. The current environment mirrors patterns observed in late 2024, where gamma squeezes and short covering propelled temporary spikes without altering the underlying macro trend. According to on-chain data, the accumulation of call options and ETF inflows has created a Fair Value Gap (FVG) near $97,000, a level now acting as a critical Order Block. Underlying this trend, the broader cryptocurrency news shows regulatory developments influencing market sentiment, such as the ongoing CLARITY Act negotiations, which could impact stablecoin liquidity and, by extension, Bitcoin's correlation with traditional finance.
On Tuesday, Bitcoin pushed past $97,000, driven by internal market liquidity rather than macroeconomic catalysts. According to crypto market maker and ETF liquidity provider Flowdesk, the price increase resulted from strong short covering and an influx of call option purchases, with over $800 million in recent ETF inflows bolstering buy-side liquidity. Similarly, Enflux confirmed that this move was a liquidity grab, concluding the market is better suited for strategic positioning than entering a new trend. These primary sources indicate the rally lacks fundamental support from factors like Fed policy shifts or institutional adoption waves.
Market structure suggests Bitcoin is testing a key resistance zone between $97,000 and $100,000, with the Relative Strength Index (RSI) hovering near overbought territory. The 50-day moving average at $93,500 provides dynamic support, while a Fibonacci retracement level from the 2025 high indicates critical support at $92,000. Volume Profile analysis shows diminished buying pressure above $98,000, reinforcing the notion of a technically driven rebound. Consequently, the Bullish Invalidation level is set at $92,000; a break below would invalidate the short-term uptrend. The Bearish Invalidation level is $100,500, where a sustained close above could signal a shift in market structure.
| Metric | Value |
|---|---|
| Current Bitcoin Price | $95,520 |
| 24-Hour Trend | -0.75% |
| Crypto Fear & Greed Index | 49/100 (Neutral) |
| Recent ETF Inflows | $800 million |
| Key Resistance Level | $100,000 |
For institutional investors, this analysis highlights the risk of mistaking liquidity-driven moves for trend reversals, potentially leading to misallocated capital in Bitcoin ETFs. Retail traders face increased volatility near psychological levels, with the potential for sharp pullbacks if short covering subsides. The reliance on internal market liquidity, as noted by Enflux, the importance of monitoring on-chain metrics like exchange flows and UTXO age rather than headline price action. This event matters for the 5-year horizon as it reinforces the need for disciplined risk management in cyclical markets.
Market analysts on X/Twitter are divided, with bulls pointing to the $100,000 target as a momentum catalyst, while bears emphasize the lack of macro drivers. One quant trader noted, "The gamma squeeze from call options is creating artificial buy pressure, but the Volume Profile doesn't support a breakout." This sentiment aligns with Flowdesk's data, suggesting the rally is more technical than fundamental.
Bullish Case: If Bitcoin sustains above the $97,000 Order Block and breaks $100,500, it could trigger a gamma squeeze toward $105,000, driven by continued ETF inflows and positive regulatory developments, such as those detailed in Iran's growing crypto market adoption as a hedge.
Bearish Case: A rejection at $100,000 followed by a break below the Fibonacci support at $92,000 could lead to a retest of $88,000, as short covering unwinds and ETF flows normalize. Historical cycles suggest such liquidity-driven rallies often correct by 10-15%.
Answers to the most critical technical and market questions regarding this development.

Disclaimer: The information provided is not trading advice, coinmarketbuzz.com holds no liability for any investments made based on the information provided on this page. We strongly recommend independent research and/or consultation with a qualified professional before making any investment decisions.
coinmarketbuzz.com leverages advanced AI technology to analyze market data. All content is fact-checked and reviewed by our editorial team to ensure accuracy and neutrality.