Loading News...
Loading...
Loading News...

VADODARA, January 17, 2026 — Bitcoin's price action has captured market attention with a technical breakout above $95,000, prompting a daily crypto analysis that projects a potential rally to $107,000. According to a Cointelegraph analysis, this move is driven by three factors: a completed ascending triangle breakout, easing sell-offs from long-term holders, and an environment of expanding global liquidity. However, market structure suggests contradictions in the data warrant a skeptical examination of these narratives.
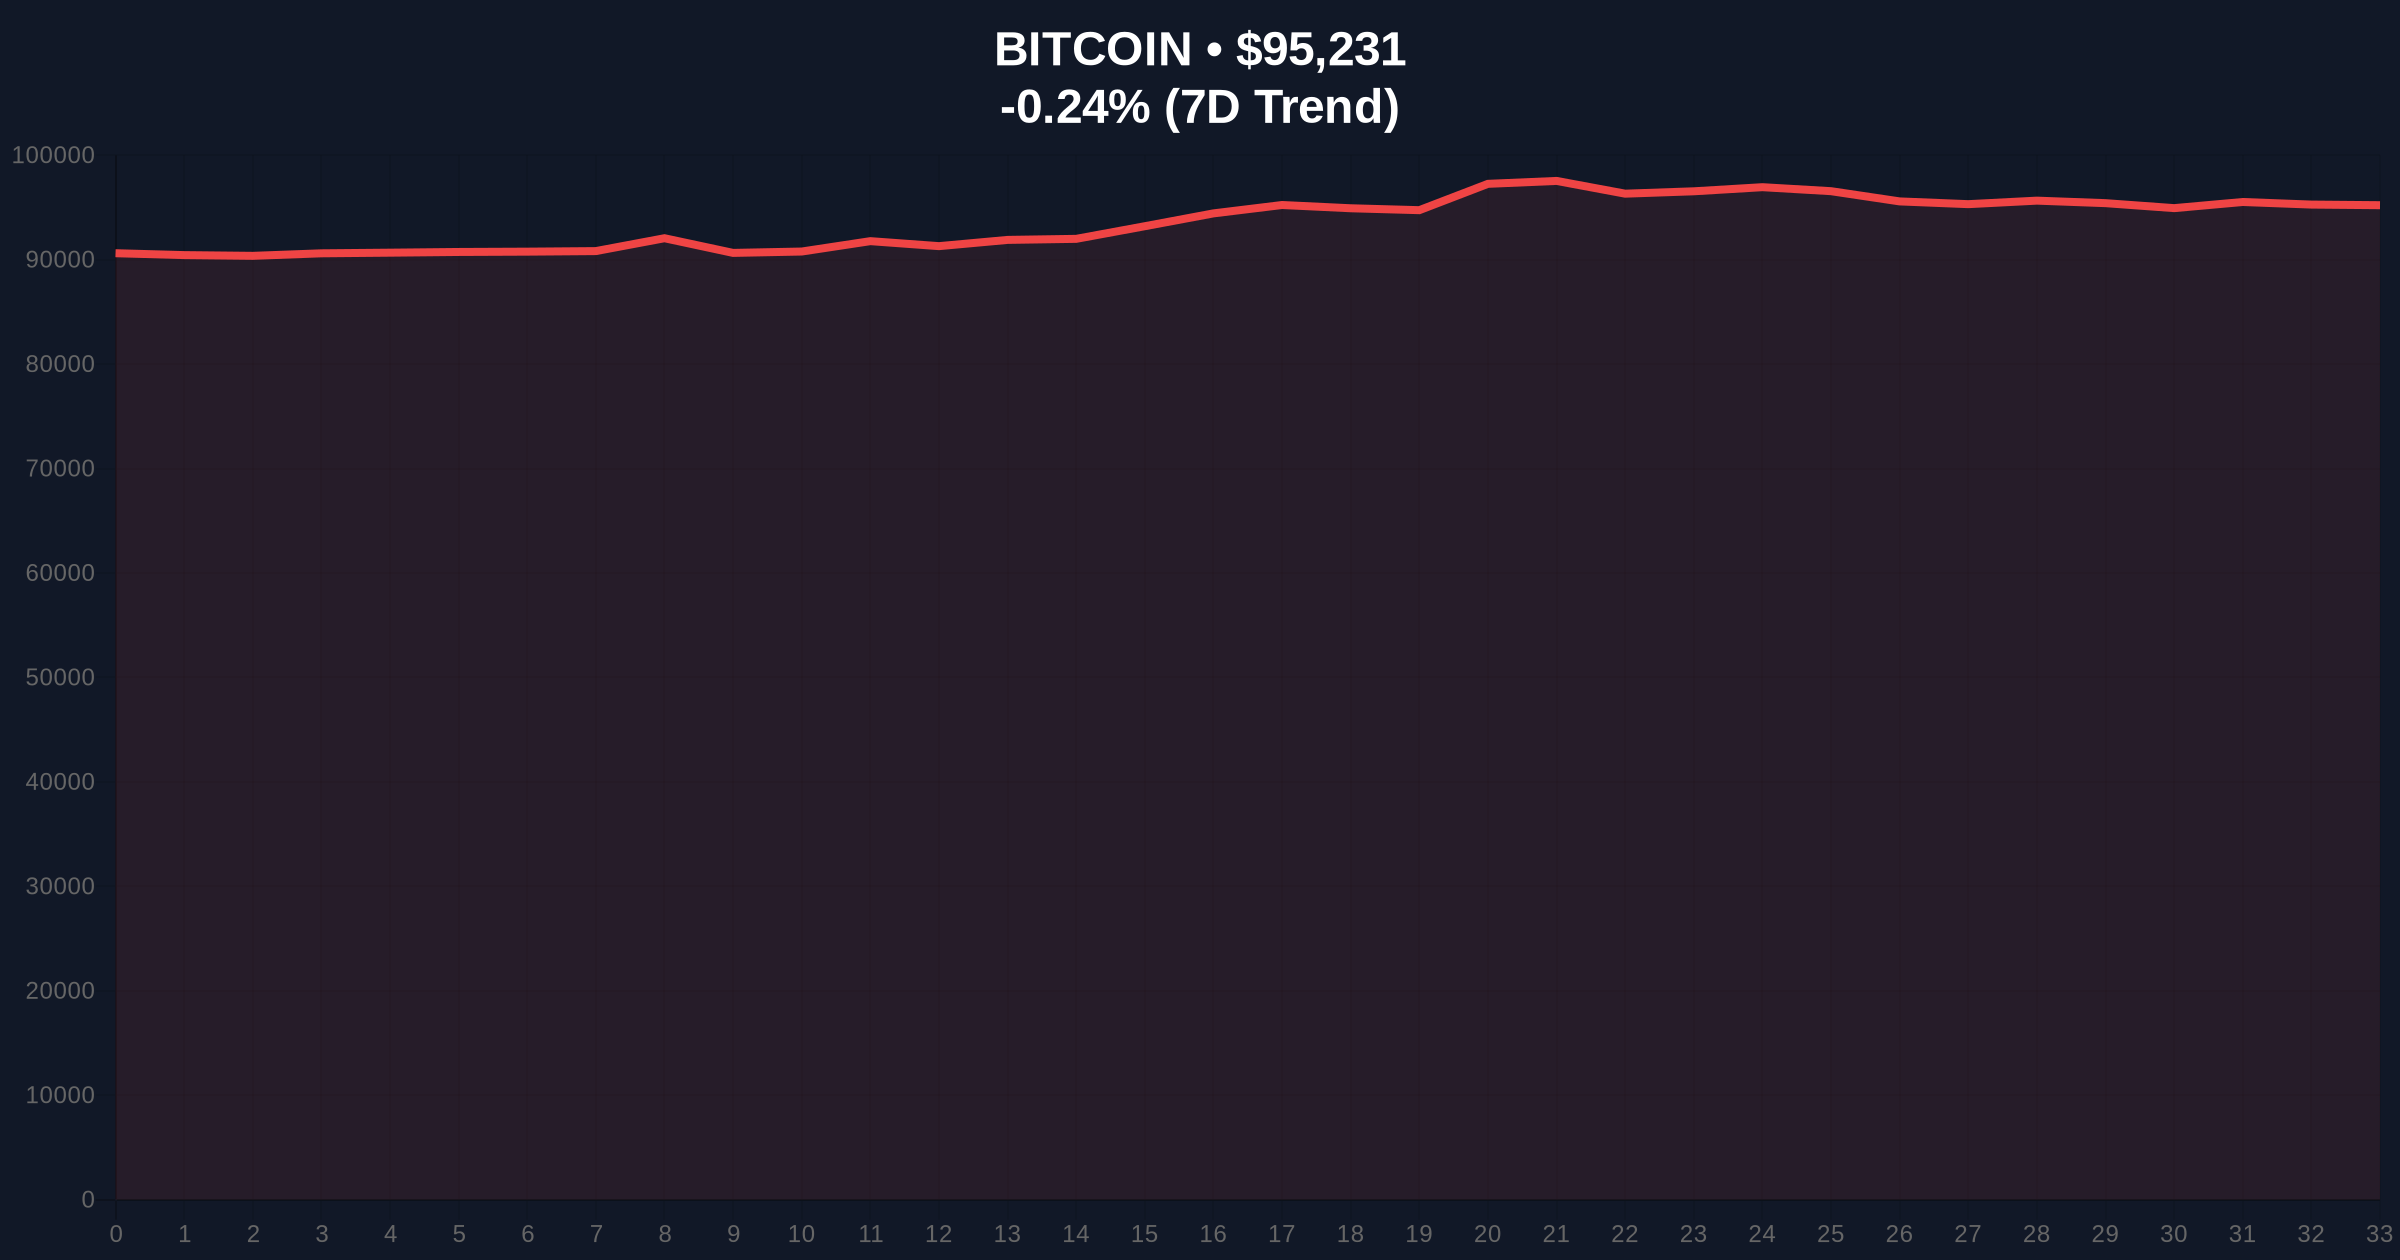
Bitcoin's current price of $95,237 represents a critical juncture, mirroring historical patterns where breakouts from consolidation phases have led to significant volatility. The ascending triangle pattern, identified in the analysis, is a common technical formation that often precedes upward moves, but its reliability depends on volume confirmation and macroeconomic backdrop. This development occurs against a backdrop of regulatory scrutiny and liquidity shifts, as seen in recent events like Binance's delisting of perpetual futures contracts, which may impact market depth. Historical cycles suggest that post-halving periods, such as the current phase following the 2024 event, typically exhibit bullish tendencies, but external factors like Federal Reserve policy can override technical signals.
On January 17, 2026, Bitcoin surpassed the $95,000 upper boundary of an ascending triangle pattern, as reported by Cointelegraph. The analysis indicates that this level is now acting as support, with a golden cross of the 20-day and 50-day moving averages imminent. Additionally, outflows from investors holding BTC for over five years have dropped to less than half of their cycle peak, suggesting reduced selling pressure from long-term holders. The analysis further posits that expanding global liquidity and the end of the Federal Reserve's quantitative tightening could drive Bitcoin to outperform gold. However, on-chain data from Glassnode indicates that while UTXO age bands show decreased activity from veteran holders, this does not necessarily equate to bullish sentiment without corroborating volume profile data.
Market structure suggests the breakout above $95,000 has created a Fair Value Gap (FVG) that may need to be filled if momentum wanes. The ascending triangle's measured move target projects to approximately $107,000, but this relies on sustained buying pressure above the breakout level. Key support zones include the $92,500 area, which aligns with the 20-day moving average and previous order block resistance-turned-support. Resistance levels are observed near $98,000 and $102,000, based on historical volume clusters. The RSI (Relative Strength Index) is approaching overbought territory, indicating potential for a short-term pullback. Bullish invalidation is set at $92,500; a break below would negate the triangle breakout and suggest a liquidity grab. Bearish invalidation is at $100,000; a sustained move above could trigger a gamma squeeze toward higher targets.
| Metric | Value | Source |
|---|---|---|
| Current Bitcoin Price | $95,237 | CoinMarketCap |
| 24-Hour Trend | -0.24% | Live Market Data |
| Crypto Fear & Greed Index | 50/100 (Neutral) | Alternative.me |
| Market Rank | #1 | CoinMarketCap |
| Long-Term Holder Outflow Reduction | Less than half of cycle peak | Glassnode |
For institutional investors, a confirmed breakout toward $107,000 could validate Bitcoin's role as a macro hedge, especially if it outperforms gold as suggested. However, skepticism arises from the reliance on global liquidity narratives; according to the Federal Reserve's latest statements, quantitative tightening may ease, but inflation data remains volatile, complicating the liquidity outlook. Retail traders face increased risk of false breakouts, as seen in past cycles where ascending triangles failed without volume support. The interplay between technical patterns and macroeconomic factors, such as interest rate decisions, will dictate Bitcoin's 5-year trajectory, making this analysis critical for portfolio allocation.
Market analysts on X/Twitter are divided: bulls highlight the golden cross and reduced sell-offs as bullish signals, while bears point to overextended RSI levels and potential regulatory headwinds. One trader noted, "The breakout looks clean, but we need to see if $95K holds as support on a weekly close." Others reference similar liquidity events, such as Solayer's team wallet deposits to Binance, warning of possible distribution phases. Overall, sentiment aligns with the neutral Crypto Fear & Greed Index, reflecting cautious optimism tempered by data contradictions.
Bullish Case: If Bitcoin maintains support above $95,000 and the golden cross materializes, the measured move target of $107,000 becomes plausible. Easing sell-offs from long-term holders could reduce overhead supply, while expanding global liquidity, as hinted by the Federal Reserve, may drive capital inflows. A break above $100,000 could trigger a gamma squeeze, accelerating gains toward $110,000.
Bearish Case: Failure to hold $95,000 as support would invalidate the breakout, suggesting a liquidity grab and potential drop to $90,000 or lower. Macroeconomic uncertainties, such as persistent inflation leading to delayed rate cuts, could dampen liquidity narratives. Additionally, if long-term holder outflows resume or volume profile indicates weak accumulation, a correction to the $85,000 Fibonacci support level is likely.
Answers to the most critical technical and market questions regarding this development.

Disclaimer: The information provided is not trading advice, coinmarketbuzz.com holds no liability for any investments made based on the information provided on this page. We strongly recommend independent research and/or consultation with a qualified professional before making any investment decisions.
coinmarketbuzz.com leverages advanced AI technology to analyze market data. All content is fact-checked and reviewed by our editorial team to ensure accuracy and neutrality.